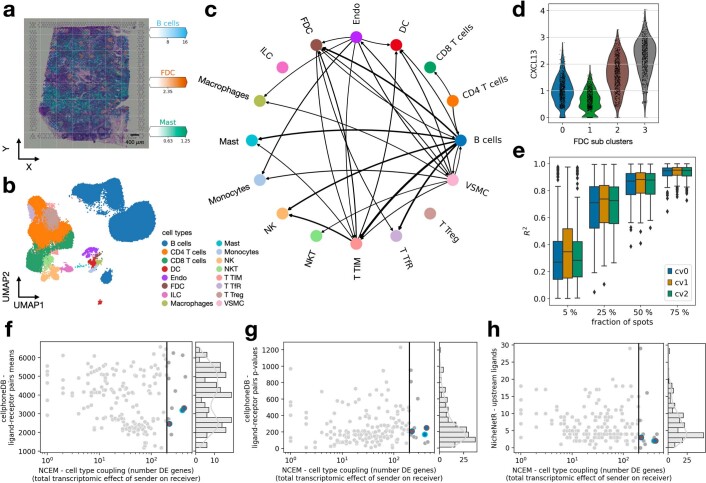
Extended Data Fig. 4. Robustness of cell communication inference on deconvoluted spot transcriptomics data.
(a) 10x Visium slide of a lymph node with the spot-wise abundance of B cells, follicular dendritic cells (FDC), and mast cells inferred with cell2location superimposed. (b) UMAP of cells in a matched scRNA-seq data set of human lymph nodes, spleen and tonsils with cell types superimposed. (c) Type coupling heatmap of the Visium – lymph node dataset, with edge width proportional to the number of differentially expressed genes at a false-discovery-rate-corrected p-value threshold of 0.05 for each pair of sender and receiver cell types. Only edges with at least 200 genes are shown. (d) Violin plot of Cxcl13 expression per cell for FDC subclusters in the Visium - lymph node data. (e) Robustness of type coupling analysis in a Visium slide on human lymph nodes. Shown are R2 between inferred cell type coupling vectors of randomly subsampled spots and the complete data for subsampling ratios of 5 %, 25 %, 50% and 75 % in three cross validations (n = 256 type couplings in each boxplot). For each box, the centerline defines the median, the height of the box is given by the interquartile range (IQR), the whiskers are given by 1.5 * IQR and outliers are given as points beyond the minimum or maximum whisker. (f-h) Correlation of measures of cell communication events between pairs of cell types compared with type coupling scores from NCEM on the tabular sapiens lymph node dataset. Shown are CellphoneDB permutation test results with the number of ligand-receptor pairs with positive mean expression (f), number of ligand-receptor pairs with a FDR-corrected p-value below a threshold of 0.05 (g) and the number of ligands associated with a pair of cell types as identified by NicheNet (h) (Methods). Each point is one pair of cell types. The vertical line indicates the threshold for showing edges in Fig. 2b.

