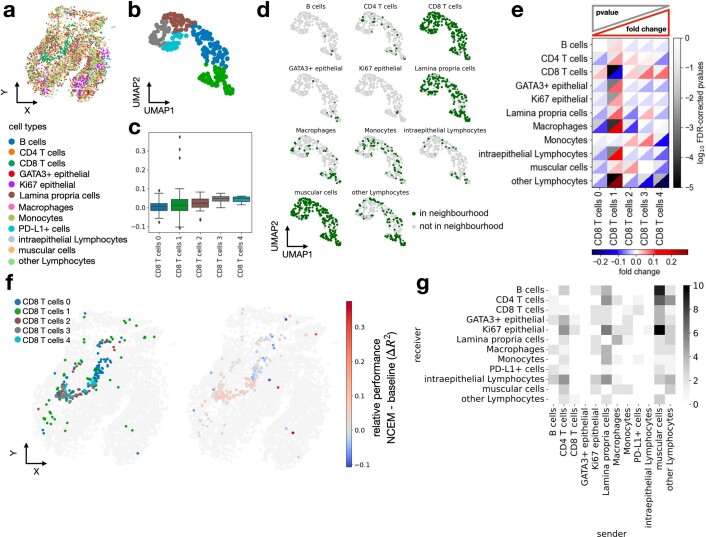
Extended Data Fig. 6. Attributing cell heterogeneity to niche composition in inflamed colon.
(a) Area 1 of chip cytometry – colon dataset with cell-types superimposed. (b) UMAPs of molecular embedding of CD8 T cells only with molecular subclustering superimposed (colors as in c). (c) Distribution of cell-wise difference of R2 between spatial model non nonspatial baseline model by molecular sub-cluster (CD8 T cells 0: n = 74, CD8 T cells 1: n = 58, CD8 T cells 2: n = 41, CD8 T cells 3: n = 37, CD8 T cells 4: n = 24). The centerline of the boxplots defines the median, the height of the box is given by the interquartile range (IQR), the whiskers are given by 1.5 * IQR and outliers are given as points beyond the minimum or maximum whisker. (d) UMAPs of molecular embedding of all CD8 T cells in area 1 (n = 234 cells) showing if a given cell-type is present in the neighborhood. The underlying neighborhoods were defined at the best performing resolution identified in Fig. 1c (40 µm). (e) Heatmap of fold change and false-discovery rate corrected p-values of cluster enrichment of binary neighborhood labels, where fold changes are the ratio between the relative neighboring source cell-type frequencies per subtype cluster and the overall source cell-type frequency in the image. (f) Area 1 of colon in the chip cytometry – colon dataset with CD8 T cell sub-states (left) and the difference of R2 between the NCEM interaction model at resolution of 40 µm and the best nonspatial baseline model (right). (g) Type coupling analysis, showing the number of differentially expressed genes at a false-discovery-rate-corrected p-value threshold of 0.05 for each pair of sender and receiver cell types.

