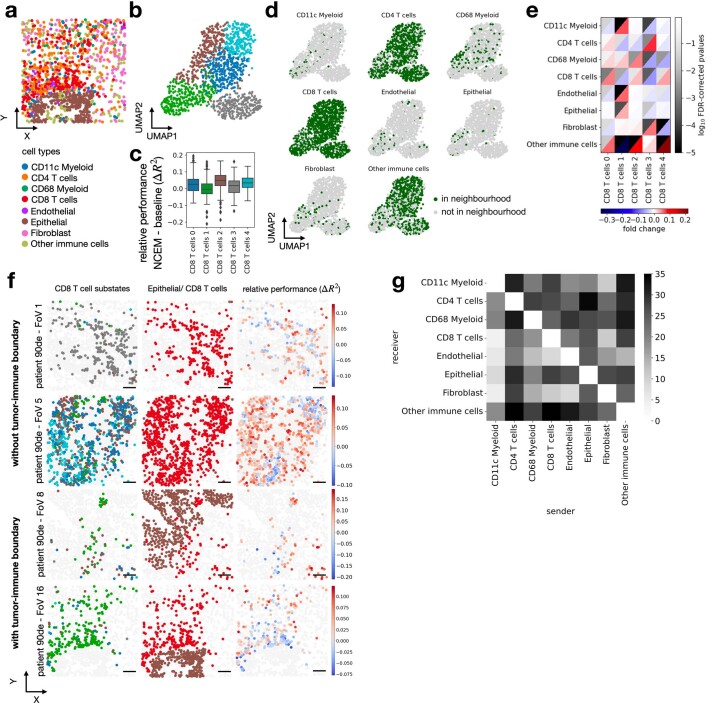
Extended Data Fig. 7. Attributing cell heterogeneity to niche composition in colorectal cancer.
(a) Field of view 16 of MIBI TOF – cancer dataset with the spatial allocation of all cell-types superimposed. (b) UMAPs of molecular embedding of CD8 T cells only with molecular sub-clustering superimposed (colors as in c). (c) Distribution of cell-wise difference of R2 between spatial model non-spatial baseline model by molecular sub-cluster (CD8 T cells 0: n = 304, CD8 T cells 1: n = 293, CD8 T cells 2: n = 278, CD8 T cells 3: n = 247, CD8 T cells 4: n = 207). The centerline of the boxplots defines the median, the height of the box is given by the interquartile range (IQR), the whiskers are given by 1.5 * IQR and outliers are given as points beyond the minimum or maximum whisker. (d) UMAPs of molecular embedding of all CD8 T cells in area 1 (n = 1,329 cells) showing if a given cell type is present in the neighborhood. The underlying neighborhoods were defined at the optimal resolution identified in Fig. 1d (13 µm). (e) Heatmap of fold change and false-discovery rate corrected p-values of cluster enrichment of binary neighborhood labels, where fold changes are the ratio between the relative neighboring source cell-type frequencies per subtype cluster and the overall source cell-type frequency in the image. (f) Field of view 1, 5, 8 and 16 of colon in the MIBI TOF – cancer dataset with CD8 T cell sub-states, cell type assignments to epithelial and T cells, and the difference of R2 between the NCEM interaction model at a resolution of 13 µm and the best nonspatial baseline model (scale bar 50 µm). (g) Type coupling analysis, showing the number of differentially expressed genes at a false-discovery-rate-corrected p-value threshold of 0.05 for each pair of sender and receiver cell types.

