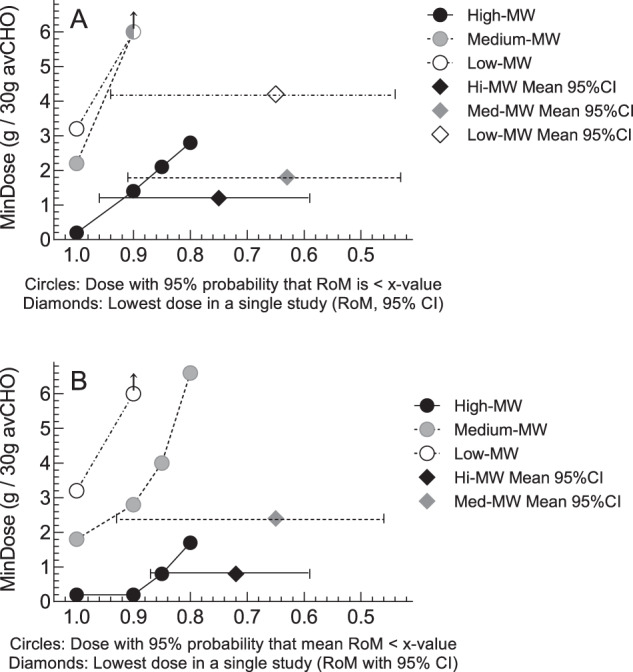
Fig. 3. Minimum OBG dose required to lower glucose iAUC and glucose iPeak by MW in participants without type 2 diabetes.

Footnotes Panel (A) minimum dose of oat β-glucan (OBG; g per 30 g available carbohydrate), required to reduce glucose iAUC (MinDose). Panel (B): MinDose of OBG to reduce glucose iPeak. Both panels: circles show the MinDoses (y-axis) associated with a 95% probability that RoM is <x-axis values of 1.0, 0.9, 0.85 and 0.8 (i.e., mean reductions of >0%, >10%, >15% and >20%, respectively). Black, gray and open circles, respectively, are for high-MW (>1000 kg/mol) medium-MW (300–1000 kg/mol) and low-MW (<300 kg/mol) OBG. Arrows on circles indicate that MinDose is > the largest dose studied. Black, gray and open diamonds, respectively, show the dose and RoM ± 95% confidence intervals of the lowest dose of high-MW, medium-MW and low-MW OBG in any single study to elicit a statistically significant reduction in glucose iAUC (Panel A) or glucose iPeak (Panel B). There is no open diamond in Panel B because no study elicited a significant reduction in glucose iPeak.
