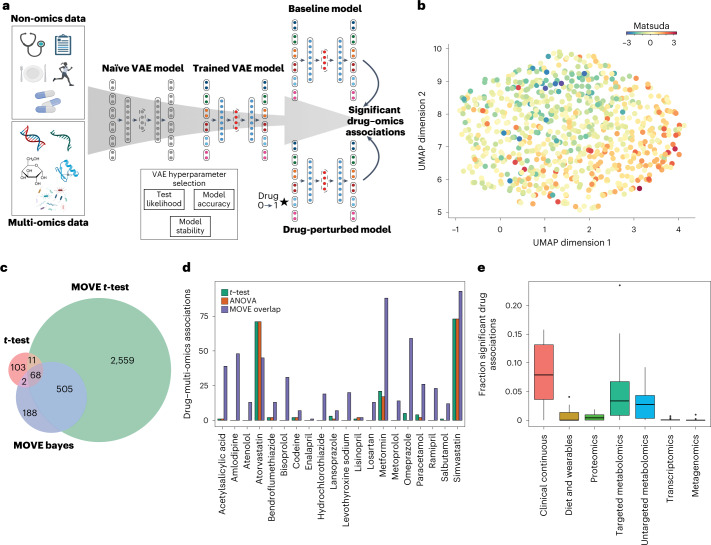
Fig. 1. Integrating multi-omics data with a VAE.
a, Principle of integration and analysis approach using MOVE. Individual-level non-omics and multi-omics data were used as input to a VAE. The optimal network hyperparameters were estimated from the summed test set error across all individuals in the test (test likelihood), training reconstruction accuracy, and model stability. Significant drug–omics associations were identified by perturbing drug status from no (0) to yes (1) for all individuals that were not already administered the drug. b, UMAP representation of the latent representation from the 789 people with newly diagnosed T2D. Individuals were colored according to their z-scaled Matsuda index from low (blue), average (yellow), and high (red). c, Overlap in significant drug–omics associations between standard t-test (two-sided, Benjamini–Hochberg FDR < 0.01) on the input data, MOVE t-test (multi-stage Bonferroni-corrected, P adjust < 0.05) and MOVE Bayes approaches (FDR Bayes < 0.05). The different methods of multiple testing correction corresponded to FDR of 0.05 on the ground-truth dataset. The overlap between MOVE t-test and MOVE Bayes was used for further analysis (n = 573). d, The number of significant associations found between drugs and features in the multi-omics datasets using MOVE t-test and MOVE Bayes (purple), t-test (green) or ANOVA (orange). See c for information on the tests. e, Fraction of features in the multi-omics datasets that was found by MOVE to be significantly associated with at least one drug (n = 20). The lower and upper hinges correspond to the first and third quartiles. The upper and lower whiskers extend from the hinge to the highest and lowest values, respectively, but no further than 1.5× interquartile range from the hinge. Data beyond the ends of whiskers are outliers and are plotted individually.

