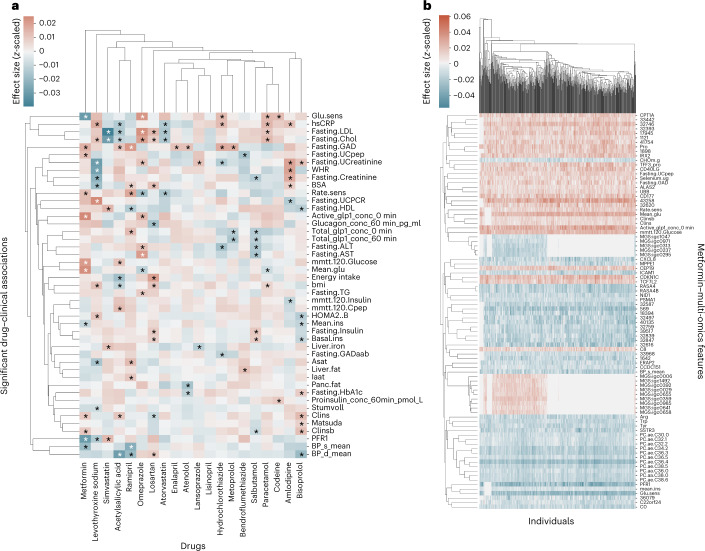
Fig. 2. Significant associations between drugs, clinical, and multi-omics features.
a, Significant associations between drugs and clinical features. Effects are given as effect size (z-scaled units) from negative (blue) to positive (red). Significant associations identified by both MOVE t-test and MOVE Bayes are indicated using a star. Features (y-axis) and drugs (x-axis) are clustered using hierarchical clustering on the basis of Euclidean distances. b, As in a but showing per individual-level associations of metformin to multi-omics features demonstrating that associations are highly stable across individuals. Features (y-axis) and newly diagnosed T2D individuals (x-axis).

