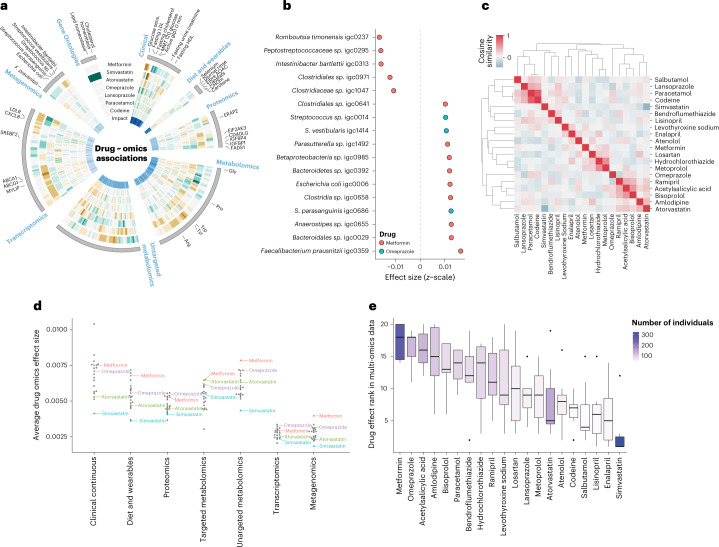
Fig. 3. Drug associations with metagenomics species and drug–drug similarities.
a, Display of effect sizes (z-scaled units) for (outer to inner) metformin, simvastatin, atorvastatin, omeprazole, lansoprazole, paracetamol, and codeine. Only significant associations to any of the drugs are shown and effect size is visualized as brown (negative), gray (none), and green (positive). Selected omics features are indicated. The Gene Ontologies element represents significantly over-represented Gene Ontology terms using transcriptomics (hypergeometric test, FDR < 0.05) (green). The innermost ring indicates SHAP importance for the individual features in the encoding from input data to the latent representation. b, Effect size (z-scaled units) (x-axis) of the human gut metagenomics species that were significantly associated with metformin (orange) or omeprazole (teal). c, Drug–drug similarities by comparing drug-response profiles across the multi-omics datasets. Cosine similarity indicated from no similarity (blue) to identical profiles (red). d, Average effect (z-score) of drugs for the omics datasets. All 20 drugs are shown, however, only metformin (red), omeprazole (purple), atorvastatin (green), and simvastatin (blue) are indicated. All other drugs are colored gray without a text label. e, Distribution of multi-omics ranks for the different drugs. The ranks are determined as a number between 1–20 (drugs) on the basis of the average effect size from d. The boxes are colored according to number of individuals taking a particular drug from 0 (white) to 323 (purple). There was no correlation between rank scores and number of individuals taking a drug (PCC = 0.14). The lower and upper hinges correspond to the first and third quartiles. The upper and lower whiskers extend from the hinge to the highest and lowest values, respectively, but no further than 1.5× interquartile range from the hinge. Data beyond the ends of whiskers are outliers and are plotted individually.

