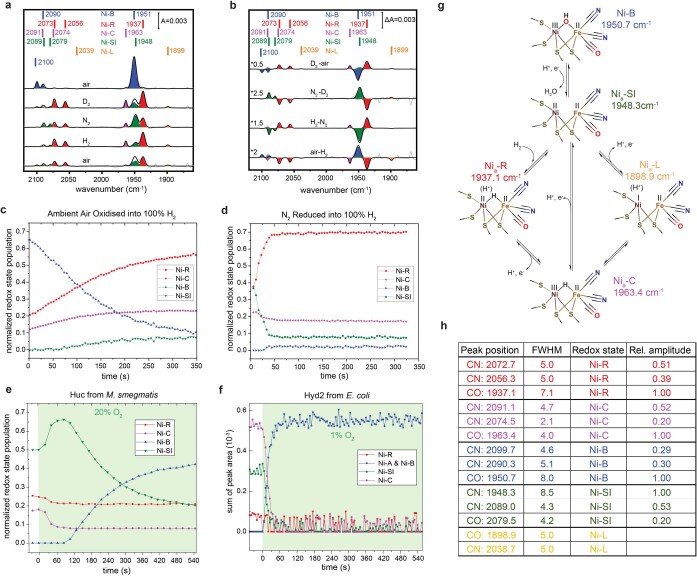
Extended Data Fig. 8. FTIR analysis of Huc in the presence of ambient air, N2 or H2.
(a) Absolute FTIR spectra of Huc equilibrated in air, followed by sequential equilibration in a 100% atmosphere of the labelled gas, followed by air. [NiFe] cluster states are assigned based on literature-derived values (see Supplementary Table 3). (b) Difference spectra derived from spectra shown in panel a. (c) A time-course plot showing the relative fractions of the FTIR assigned states immediately following the transfer of Huc from ambient air to a 100% H2 atmosphere, the catalytic Ni-R state becomes populated at the expense of hydroxide bound Ni-B over a time scale of minutes. (d) A time-course plot showing the relative fractions of the FTIR assigned states immediately following the transfer of Huc in a mixed Ni-SI, Ni-R state from 100% N2 to a 100% H2 atmosphere. The catalytic Ni-R state becomes populated at the expense of the non-hydrogen bound reduced Ni-SI state over a timescale of seconds. (e) A time-course plot of [NiFe] cluster states following the transfer of Huc predominantly in the Ni-SI state from 100% N2 into 80%:20% N2 to O2. Initially, the Ni-SI state is populated at the expense of the hydrogen-bound Ni-C and Ni-R states, followed by population of the Ni-B state at the expense of Ni-SI over a timescale of minutes. (f) A time-course plot of [NiFe] cluster states of Hyd2 from E. coli following the transfer from 100% N2 into 99%:1% N2 to O2. The Ni-B state is rapidly populated at the expense of all other states over a timescale of seconds. Data from Senger et al. 201885. (g) A scheme of the proposed catalytic cycle for [NiFe]-hydrogenases, showing the states occupied by Huc during FTIR analysis. (h) Vibrational frequencies for the CO and CN bands identified from FTIR spectra for each of the proposed Huc states. Peak position and FWHM units = cm–1.

