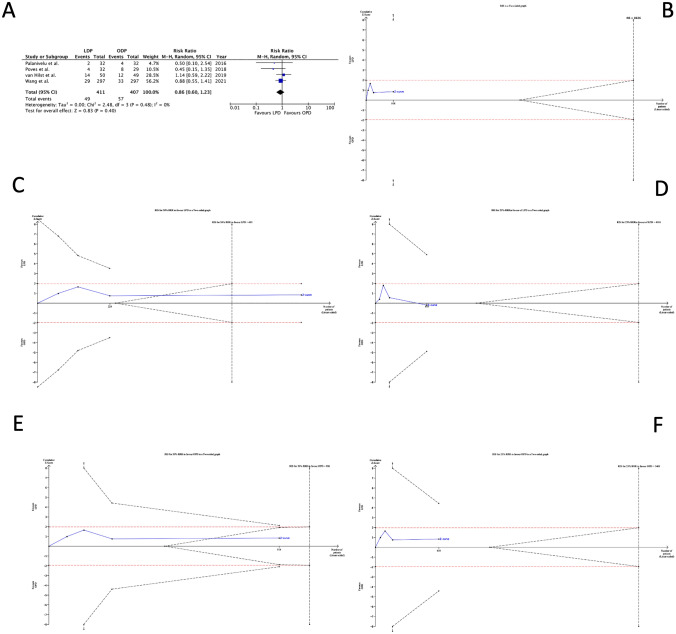
Fig. 4.
Clinically relevant postoperative pancreatic fistula. A Forest plot of meta-analysis; B–F the x-axis is the number of patients yet randomized; the y-axis is the cumulative z-score value representing the effect of each arm; and the blue line is the cumulative z-score obtained cumulating the studies. The dotted red horizontal lines are the conventional boundaries (p-value < 0.05). When z-curve crosses the conventional boundaries and the required information size (RIS) is not reached, the result is a false positive (“type I error”). When z-curve does not cross the conventional boundaries and RIS is not reached, the result is a false negative (type II error). The dotted black near-logarithmic lines are the monitoring boundaries. When the z-curve crosses the monitoring boundaries, the result is a true positive. The inverse dotted black lines are the futility boundaries (area in which any further randomization is useful). B at current RR equal to 1.04; C assuming that LPD could decrease by 50% the RR of clinically relevant postoperative pancreatic fistula rate; D assuming that OPD could drop by 50% the RR of clinically relevant postoperative pancreatic fistula rate; E bearing that LPD could reduce by 25% the RR of clinically relevant postoperative pancreatic fistula rate; and F assuming that OPD could decrease by 25% the RR of clinically relevant postoperative pancreatic fistula rate

