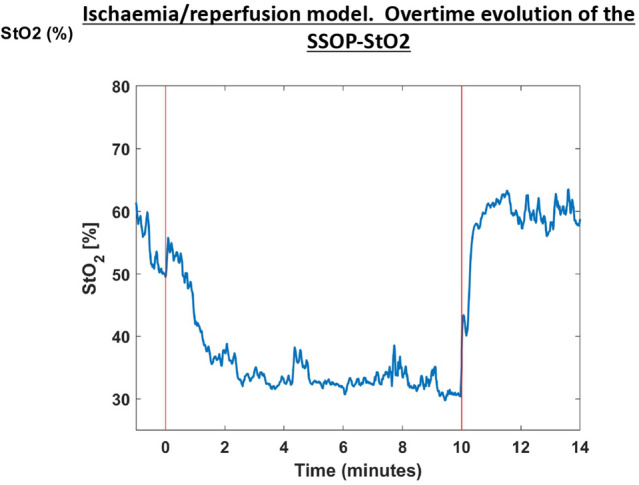
Fig. 4.

The graph shows the overtime evolution of the SSOP-StO2 parameter at baseline, occlusion, and reperfusion phases on ROI 1. Red bars represent clamping (T0) and declampling (T10), respectively. The SSOP-StO2 could precisely discriminate when the ischaemia started with a more evident decrease in 50% appreciated after 2 min of occlusion. Once the surgical clamp was released (second red bar), an improvement in saturation occurred
