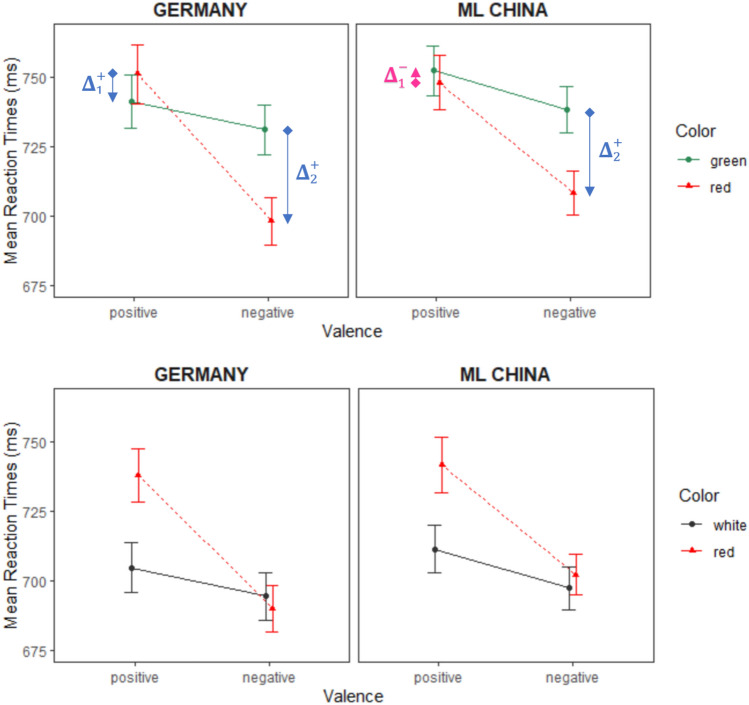
Fig. 3.
Mean reaction times for positive and negative silhouettes in Experiment 2 per Country Group (Germany versus Mainland China). The upper panel shows response times in the red–green color opposition block. The lower panel shows response times in the red–white color opposition block. Error bars indicate SEMs. To illustrate the CE in the Red-Green Condition (upper panel), blue arrows are drawn from Incongruent (black diamond) to Congruent (black inverted triangle) Color-Valence pairings, showing the category differences Δ1 and Δ2. Per Country group, the overall CE = Δ1 + Δ2, the sum of the category differences. If responses to Incongruent (black diamond) stimuli are slower than to Congruent (black inverted triangle) stimuli, then the difference Δ is positive ( +). If the inverse is true, the Δ is negative (−), reducing the summed/overall CE (depicted as a pink arrow). Note that the arrow is inverted in the Chinese Red-Green positive condition, making the Incongruent pairing (marginally) faster than the Congruent pair, leading to one inverse (= negative) term Δ1, reducing the overall Chinese CE

