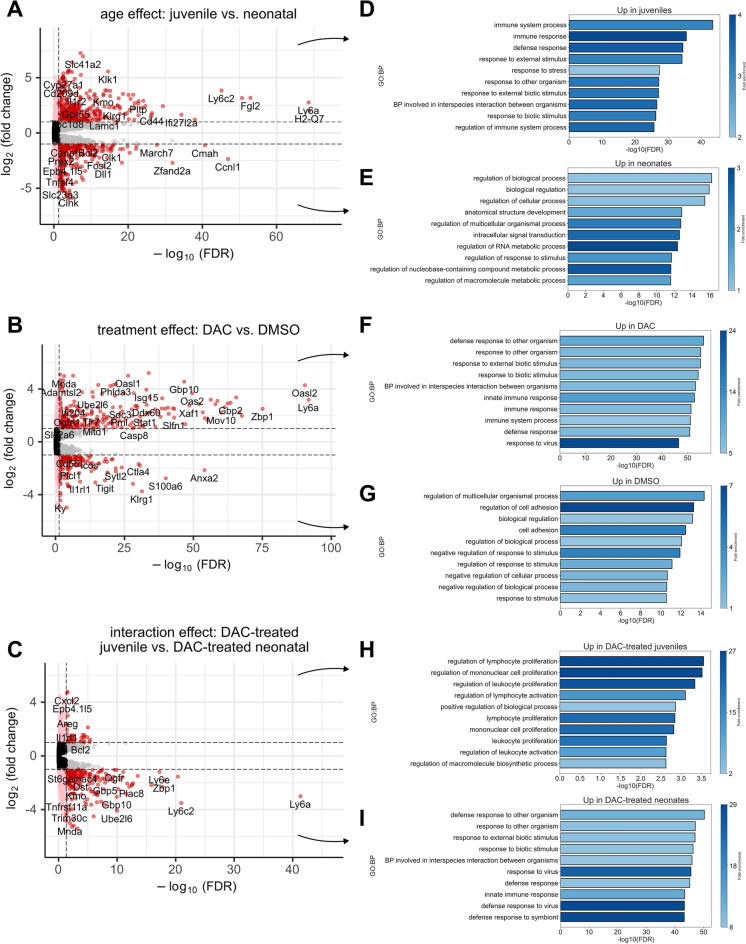
Figure 3.
Age and DAC treatment independently and in concert induce gene expression changes in immune program genes. (A) Volcano plot showing the log2-fold changes (LFCs) in gene expression as a function of age (juvenile versus neonatal). Genes with positive LFC values are expressed at higher levels in juveniles than neonates. (B) As in (A) for the DAC versus DMSO comparison after regressing out the effect of age. (C) As in (A, B) for the interaction between age and treatment status. (D) Over-representation analysis (ORA) from gProfiler showing GO: Biological Processes (GO:BP) associated with genes up-regulated in juveniles versus neonates, and (E) neonates versus juveniles. Fold-enrichment (colorbar) in this context is the number of genes associated with a term divided by the number of genes expected to be associated with that term by random chance. (F) as in (D) for genes up-regulated CD4+ T cells from DAC-treated mice versus DMSO, and (G) for DMSO-treated mice versus DAC. (H) as in (D) for genes more greatly increased in expression in DAC-treated juveniles than neonates. (I) as in (E) for genes more greatly increased in expression in DAC-treated neonates than juveniles.

