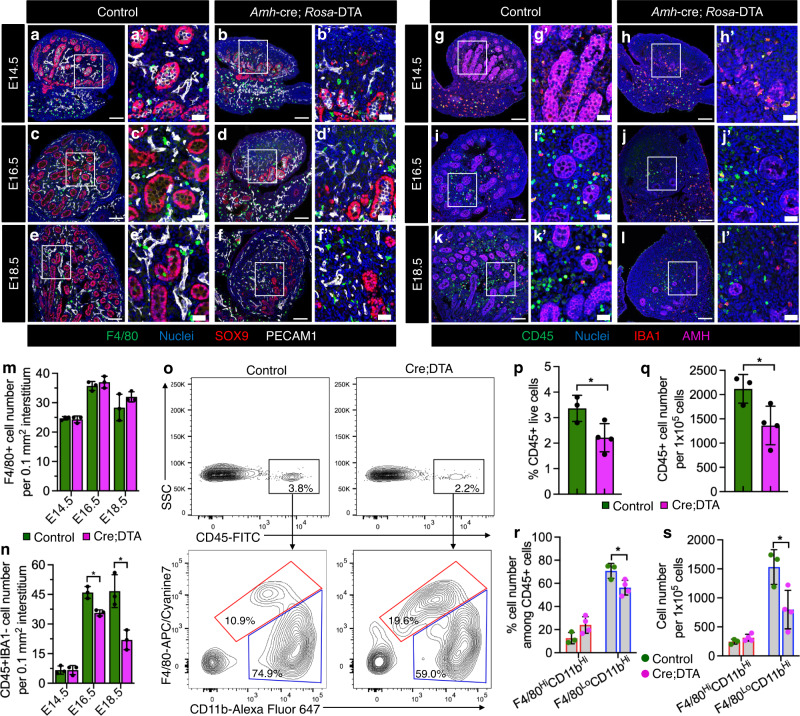
Fig. 5. Sertoli cells regulate testicular immune cell recruitment.
a–l Representative images (n = 3 independent gonads) of control (a, c, e, g, i, k) and Amh-cre; Rosa-DTA (b, d, f, h, j, l) testes at various fetal stages. Thin scale bar, 100 μm; thick scale bar, 25 μm. m, n Graphs showing number (n = 3 independent gonads) of F4/80+ cells (m) or number of CD45+ IBA1-negative cells (n) per unit area of gonadal interstitium at E14.5, E16.5, or E18.5 in control versus Amh-cre; Rosa-DTA fetal testes, as determined by stereology-based cell counts. o Representative flow cytometry analyses of E18.5 control (left) and Amh-cre; Rosa-DTA (right) fetal testes for CD45+ cells (top) and for F4/80-hi CD11b-hi (macrophages; red gate) versus F4/80-lo CD11b-hi cells (monocytes and other myeloid cells; blue gate) (bottom). p–s Graph showing flow-cytometric-based quantification of percent CD45+ cells among live total gonadal cells (p), number of CD45+ cells per 1 × 10⁵ live total gonadal cells (q), percent F4/80-hi CD11b-hi and F4/80-lo CD11b-hi cells among CD45+ cells (r), and number of F4/80-hi CD11b-hi and F4/80-lo CD11b-hi cells per 1 × 10⁵ live total gonadal cells (s) for E18.5 control (n = 3) versus Amh-cre; Rosa-DTA (n = 4) fetal testes. Data are shown as mean +/– SD. *P < 0.05 (two-tailed Student’s t-test). Exact P values are provided in the Source Data file.

