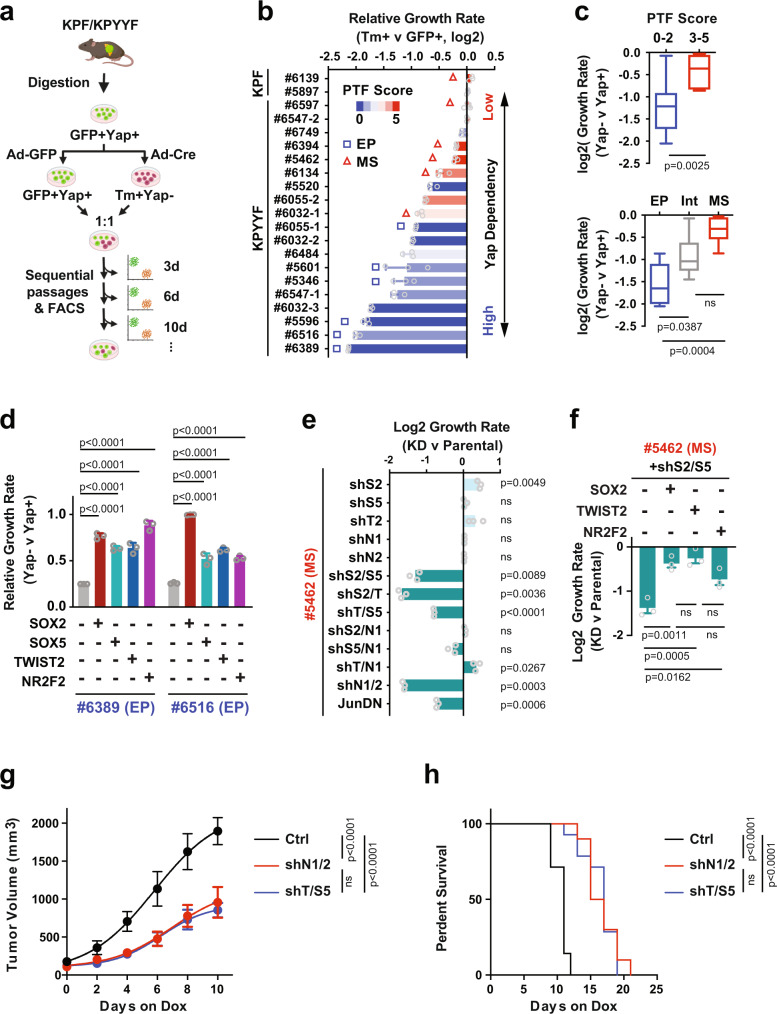
Fig. 3. PTF expression is coupled with EMT and resistance to Yap ablation.
a Illustration of the experimental design of ex vivo studies. Primary GFP+Yap+ PDAC lines isolated from KPF and KPYYF mice were infected with Ad-Cre or Ad-GFP. Equal numbers of GFP+Yap+ and Tm+Yap− PDAC cells were mixed for sequential passaging and FACS analysis every 3–4 days. Created with BioRender.com. b Log2 relative growth rate of Tm+ cells relative to GFP+ cells within the same co-cultures (n = 3 independent experiments). The PTF scores are indicated by color scales. PDAC cells classified as epithelial (EP) or mesenchymal (MS) differentiation based on Ecad expression and localization are marked by rectangles (EP) and triangles (MS), respectively. c Log2 relative growth rates of Tm+Yap− relative to GFP+Yap+ cells of KPYYF lines grouped by PTF scores or differentiation status. Top panel: n = 12 and 7 independent cell lines for the Low (0–2) and High (3–5) PTF groups, respectively. Centre at the median, box bounds 25th and 75th percentiles, whiskers minima and maxima. Unpaired, two-tailed, Student’s t-test. Bottom panel: n = 6, 7, and 6 independent cell lines from the EP, Intermediate (Int), and MS groups, respectively. One-way ANOVA with Tukey’s multiple comparisons. d Relative growth rates (Tm+Yap− versus GFP+Yap+) in two EP PDAC lines (#6516, #6389) expressing a single indicated exogenous PTF relative to the respective parental controls. n = 3. One-way ANOVA with Tukey’s multiple comparisons. e Log2 relative growth rate of the indicated single or double PTF-KD relative to parental PDAC cells derived from an MS tumor #5462 (n = 3 independent experiments). Unpaired, two-tailed, Student’s t-test. f Log2 relative growth rate of Sox2/Sox5 double KD #5462 cells with or without expressing indicated exogenous PTF relative to parental control (n = 3 independent experiments). One-way ANOVA with Tukey’s multiple comparisons. g Changes in tumor volumes of subcutaneous tumors derived from #5462 cells carrying Dox-inducible shNr2f1/Nr2f2 (shN1/N2; n = 10 mice), shTwist2/Sox5 (shT/S5; n = 15 mice), or vector control (Ctrl; n = 7 mice) after indicated days of Dox treatment. Two-way ANOVA test with multiple comparisons. h Kaplan–Meier survival curve of mice carrying Ctrl (n = 7), shN1/N2 (n = 10), and shTwist2/Sox5 (n = 15). Mantel–Cox Long Rank test. Data are presented as mean value ± SEM. Source data are provided within a Source Data file.

