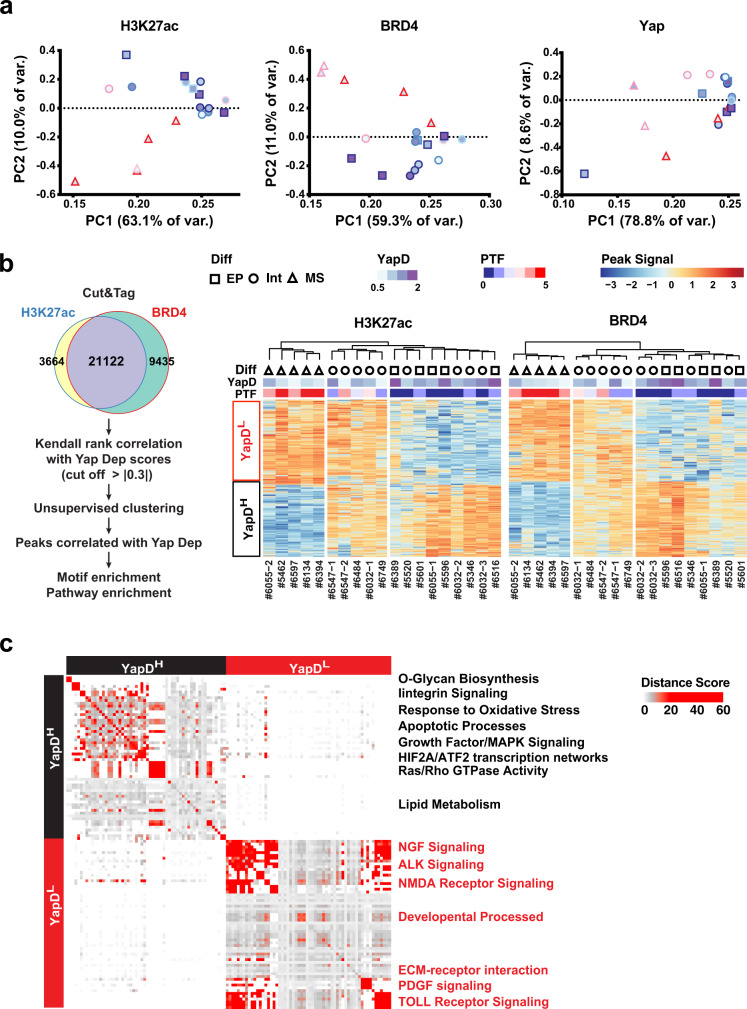
Fig. 4. Acquisition of PTF expression and Yap independency is associated with global epigenetic reprogramming.
a PCA plot segregating all 19 primary murine PDAC lines according to the global H3K27ac, BRD4, and Yap Cut&Tag signal profiles. The differentiation statuses (Diff) of PDAC lines are represented by shapes (EP: square; Int: circle; MS: triangle). The relative Yap dependency (YapD) scores are indicated by colors filling the shapes. The PTF scores are marked by the line colors of the shapes. b Analysis workflow (left) and heatmap depicting unsupervised clustering (right) of all 19 primary PDAC lines according to the signals from overlapping H3K27ac and BRD4 Cut&Tag peaks whose cross-sample signal rank variations significantly (|corr| > 0.3) correlate with high (YapDH) or low (YapDL) Yap dependency based on Kendall rank correlation. The differentiation statuses, Yap dependency, and PTF scores are depicted by the same schemes as (a). c Heatmap representing the distance scores of significantly enriched pathways or biological processes mapped to YapDH or YapDL peaks from b as determined by GREAT GeneSetCluster analysis. Source data are provided within a Source Data file.

