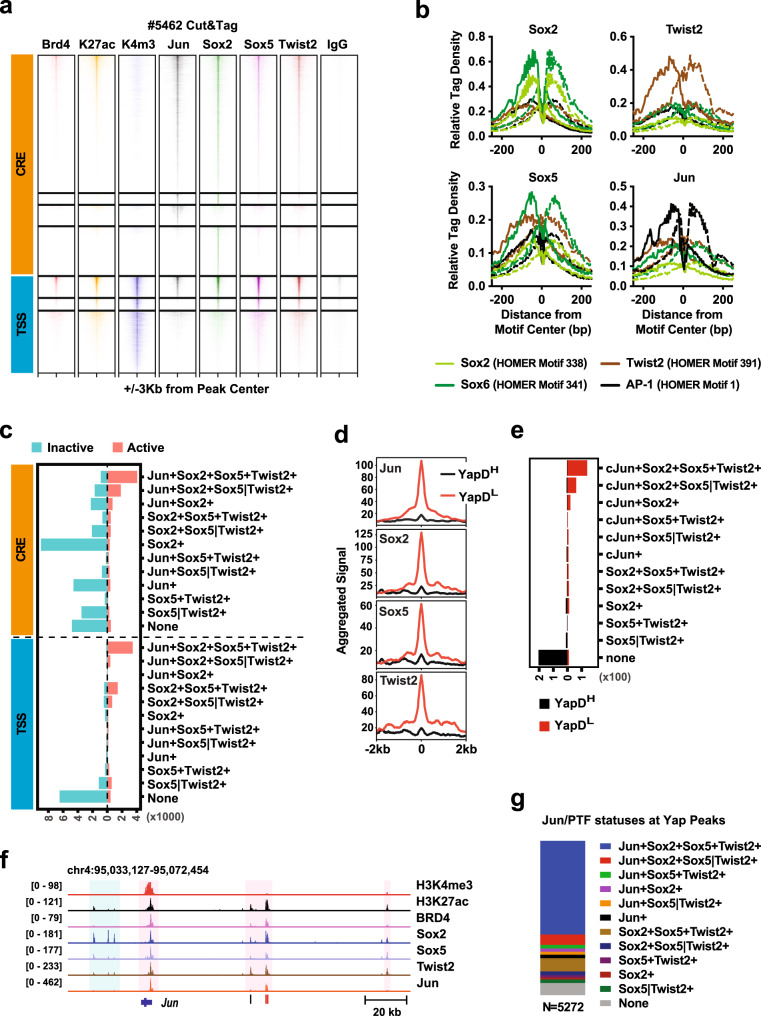
Fig. 5. PTFs and Jun co-occupy active enhancers and promoters associated with Yap independency.
a Cut&Tag signal heatmaps from the indicated antibodies within ±3kb from the centers of merged CRE and TSS sites bound by at least one of the TFs or histones in #5462 cells. TSS sites are defined by H3K4me3 positivity. b Relative Tag Density from Cut&Tag analysis of #5462 cells with indicated antibodies at ±250 bp from the centers of the indicated HOMER motif sites. c Summary of the numbers of active (light red) and inactive (light green) CRE and TSS sites with different binding statuses by Jun, Sox2, Sox5, and/or Twist2 in #5462 cells. Active CRE and TSS are defined by H3K27ac and BRD4 double positivity. Sox5|Twist2+ indicates peaks bound by either Sox5 or Twist2, but not both. d Aggregated Jun, Twist2, Sox2, and Sox5 Cut&Tag signals within ±2 kb from the centers of BRD4 peaks associated with YapDH or YapDL in #5462 cells. e Summary of the numbers of genomic loci associated with YapDH (black) and YapDL (red) with different binding statuses by Jun, Sox2, Sox5, and Twist2 in #5462 cells. f Genomic tracks showing the distributions of Cut&Tag peaks from indicated antibodies surrounding the Jun gene in #5462 cells. g Summary of the percentages of Yap peaks with different binding statuses by Jun, Sox2, Sox5, and Twist2 in #5462 cells. Source data are provided within a Source Data file. Cut&Tag data are deposited in the GEO database under accession code GSE224566.

