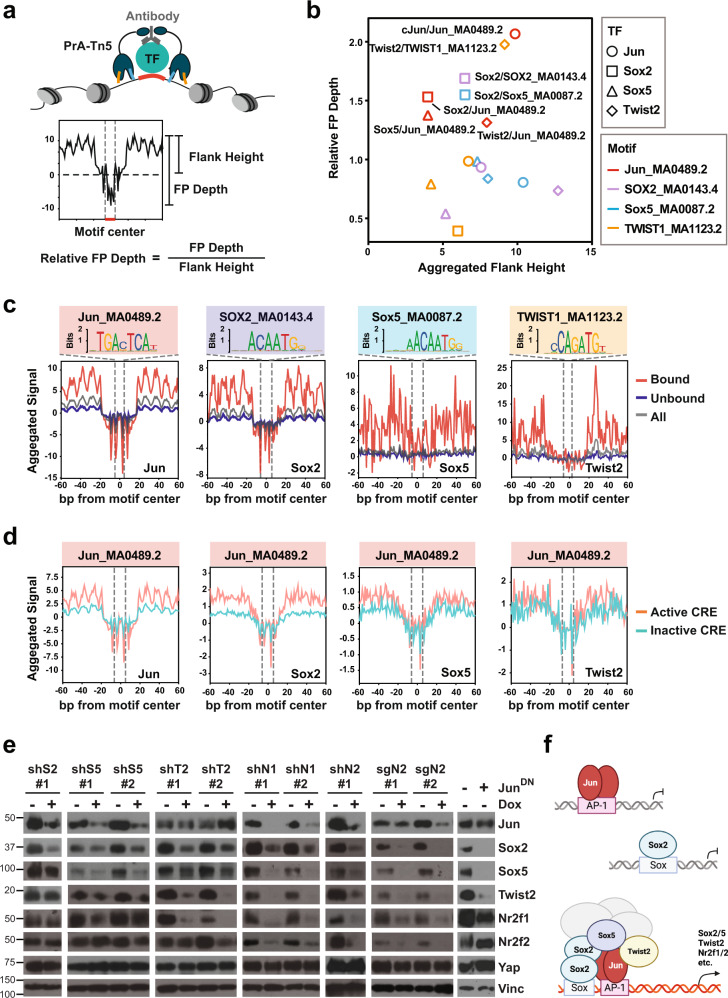
Fig. 6. PTFs and Jun form a CRC with Jun acting as the dominant chromatin anchor in Yap-independent PDAC cells.
a Schematic illustration showing chromatin-bound TF (green) recognized by its antibody (gray), which in turn recruits ProteinA-Tn5 (PrA-Tn5: dark blue) to tagment the accessible chromatin regions in the vicinity. The motif (red) bound by the TF is protected from tagmentation, leaving a footprint (FP) whose relative depth is calculated by dividing the absolute FP Depth by Flank Height (the height of peak signals immediately flanking the motif over the background). Created by S.M. b Scatter plot representing Relative FP Depths and the corresponding Aggregated Flank Heights of the indicated TFs at the sites matching the indicated motifs. TFs are represented by shapes (Jun: circle; Sox2: square; Sox5: triangle; Twist2: diamond). JASPAR motifs are presented by line colors (Jun_MA0489.2: red; SOX2_MA0143.4: purple; Sox5_MA0087.2: blue; TWIST1_MA1123.2: orange). c Aggregated signals from bound (red), unbound (blue), or all (gray) Jun, Sox2, Sox5, and Twist2 peaks centered on the indicated motif (marked by gray dashed lines). The total numbers of bound, unbound and all peaks for each antibody are Jun: 2785, 7731, and 10516; Sox2: 553, 2279, and 2832; Sox5: 127, 1452, and 1579, and Twist2: 230, 1078, and 1308. d Aggregated signal centering the Jun_MA0489.2 motif (marked by gray dashed lines) within the active (pink) or inactive (green) CRE sites bound by Jun, Sox2, Sox5, or Twist2. e Western blot analysis of indicated proteins in #5462 cells carrying Dox-inducible shRNAs or sgRNAs targeting indicated PTFs or constitutively overexpressing a dominant negative Jun mutant (JunDN) in the presence or absence of Dox. Vinc was used as the loading control. Shown is representative of three independent experiments. f A working model of cooperative binding of Jun and PTFs to AP-1 sites that drive active transcription of target genes. Created with BioRender.com. Source data are provided within a Source Data file. Cut&Tag data are deposited in the GEO database under accession code GSE224566.

