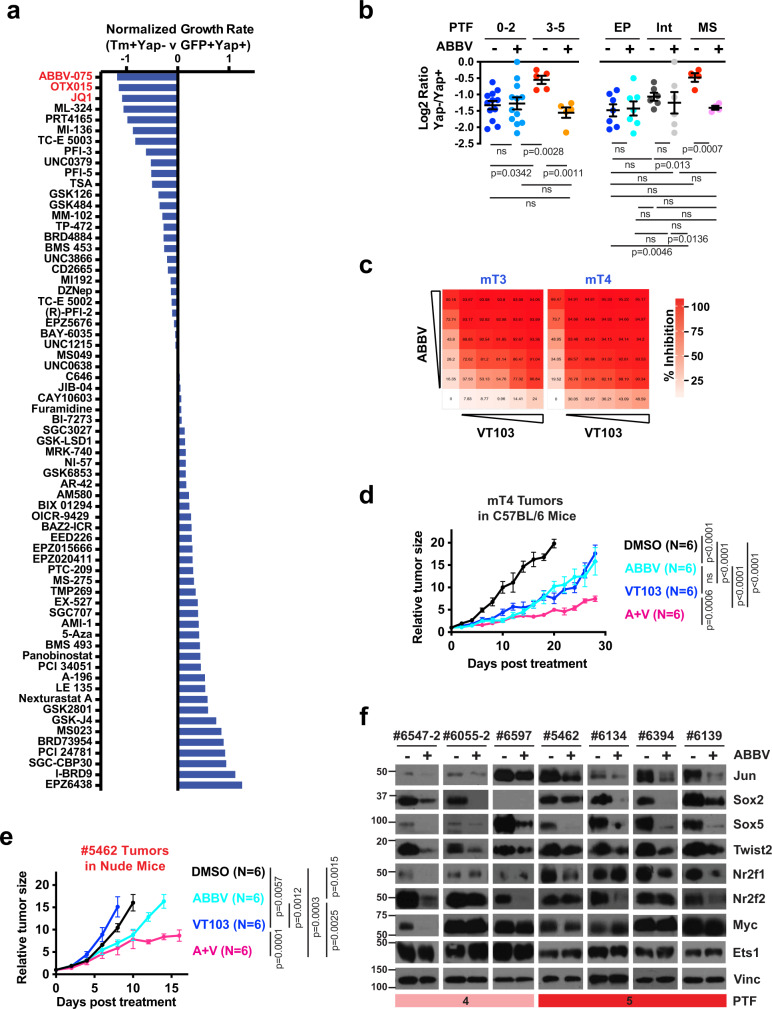
Fig. 7. BET inhibitors block the expression of PTFs and sensitize PDAC cells to Yap inhibition.
a Log2 relative growth rates of #5346 PDAC cells pre-treated with Ad-Cre (Tm+Yap−) or Ad-GFP (GFP+Yap+) co-cultured over a 2-month period in the presence of indicated epigenetic inhibitors normalized to DMSO. BET inhibitors are highlighted in red. b Log2 relative growth rates of Yap− relative to Yap+ cells in primary PDAC lines treated for 6 days with BET inhibitor ABBV-075 (+) or DMSO control (−). Primary PDAC lines are grouped based on PTF score (left) and differentiation status (right). Left panel: n = 12 and 5 independent cell lines for the Low (0–2) and High (3–5) PTF groups, respectively. Right panel: n = 7, 6, and 4 for EP, Int, and MS groups, respectively. Unpaired, two-tailed, Student’s t-test. Data are presented as mean value ± SEM. c Dose−response matrixes generated by SynergyFinder of ABBV plus Yap/Tead inhibitor VT103 in mT3 (Loewe synergy score = 31.7) and mT4 (Loewe synergy score = 30.7) PDAC cells derived from KrasG12D/+:Trp52R172H/+:Pdx-Cre (KPC) mice. d, e Changes in relative tumor size of mT4 (d) and #5462 (e) xenografts treated with ABBV (light blue), VT103 (blue), ABBV + VT103 (pink), or DMSO (black). N = 6 mice for each treatment arm. Data are presented as mean value ± SEM. Two-way ANOVA test. f Western blot analysis of indicated proteins in the indicated PTF-expressing primary PDAC lines treated with ABBV or DMSO. Vinc was used as the loading control. Shown is representative of three independent experiments. Source data are provided within a Source Data file.

