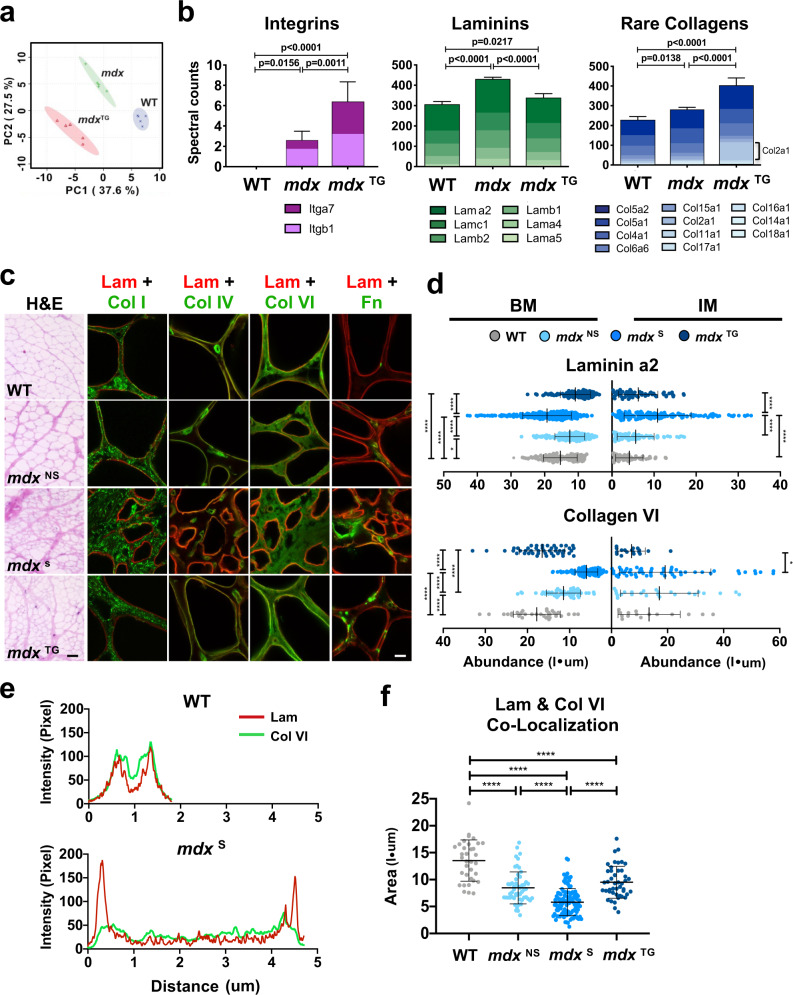
Fig. 4. Overexpression of laminin-binding complexes modulates the matrisome and alters ECM organization towards a compensatory physiological phenotype.
a Principle component analysis from ECM focused proteomics reveals distinct clustering of each phenotype, with the mdx:SSPN-Tg (mdxTG) diverging from both the WT and mdx samples (n = 5 samples/group). b Column graphs showing the abundance of integrins, laminins, and rare collagens not normally expressed in adult skeletal muscle from WT, mdx, and mdxTG samples (mean ± s.d.). P values reflect analysis by one-way ANOVA. c Representative images from myoscaffolds stained with H&E, along with immunofluorescent analysis (IFA) of myoscaffolds co-stained for laminin α2 (Lam) (red) with collagen I (Col I), IV (Col IV), VI (Col VI), and fibronectin (Fn) (green), respectively, from WT, mdxNS, mdxS, and mdxTG samples (selected images from n = 4 independent experiments). Scale bars, 100 μm (H&E) and 8 μm (IFA). d Graphs showing the abundance (pixel intensity x um (I•μm)) of laminin α2 and collagen VI in the basement membrane (BM) and interstitial matrix (IM) of WT, mdxNS, mdxS, and mdxTG ECM (mean ± s.d.). Between group differences were analyzed by one-way ANOVA. P values are as follows: *p < 0.05, **p < 0.01, ***p < 0.001, ****p < 0.0001. (n = 20–40 measurements/group for each component except laminin, where n = 80–150 measurements/group). e Representative plot profiles of the pixel intensity of laminin α2 (red) and collagen VI (green), as measured across the width of one endomysial location from confocal images of one WT and mdx myoscaffold. The peaks in the red channel represent laminin α2 in the basement membrane. The pixel intensity of laminin α2 in the basement membrane of the mdx endomysium is approximately double of that observed in the WT endomysium while the intensity of collagen VI is reduced by half. f Graph showing the relative stoichiometry between laminin α2 and collagen VI in the basement membrane of WT, mdxNS, mdxS, and mdxTG ECM (mean ± s.d.). Between group differences were analyzed by one-way ANOVA. P values are as follows: *p < 0.05, **p < 0.01, ***p < 0.001, ****p < 0.0001.

