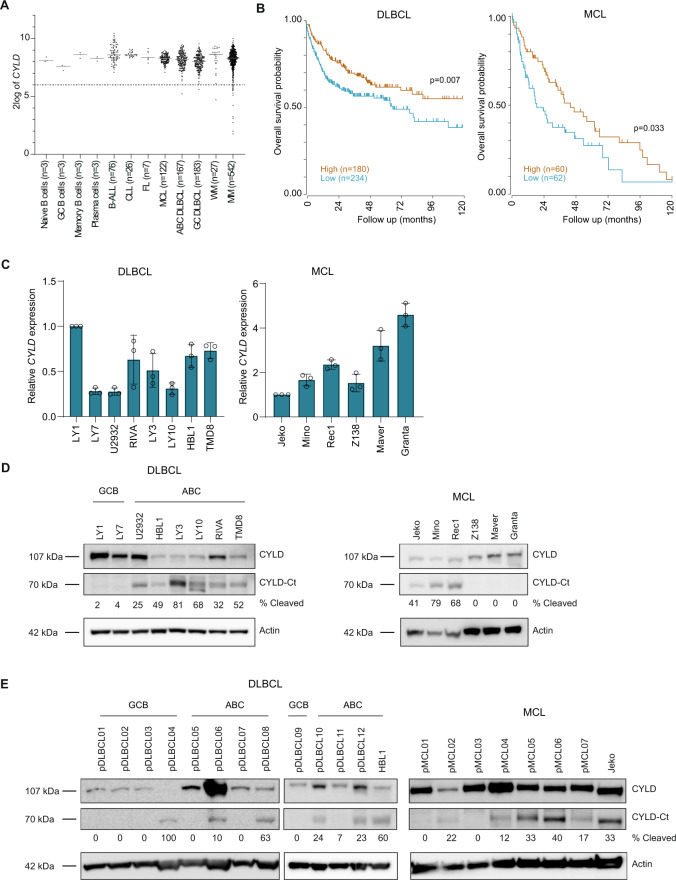
Fig. 1. CYLD is variably expressed in B-cell non-Hodgkin lymphomas (B-NHLs).
A CYLD mRNA expression analysis of publically available micro-array datasets of naïve B cells, GC (germinal center) B cells, memory B cells, plasma cells, B-cell acute lymphoblastic leukemia (B-ALL), chronic lymphocytic leukemia (CLL), follicular lymphoma (FL), mantle cell lymphoma (MCL), germinal center B-cell-like diffuse large B-cell lymphoma (GCB-DLBCL), activated B-cell-like diffuse large B-cell lymphoma (ABC-DLBCL), Waldenström’s macroglobulinemia (WM) and multiple myeloma (MM). The gray line represents the median expression value within each group. The dotted black line shows the threshold value (i.e., log-transformed probe intensity values of <26). B Kaplan–Meier survival curve showing overall survival probability in CYLD high versus CYLD low expressing DLBCL and MCL patients. The cut off was based on the average CYLD expression within each cohort. The log-rank test was used to compare the survival distributions of the two groups. C RT-qPCR analysis of CYLD mRNA expression in DLBCL and MCL cell lines. RPLP0 was used as an input control and data are normalized to CYLD expression in LY1 for DLBCL cell lines and Jeko for MCL cell lines. The mean ± SD of three independent experiments performed in triplicate is shown. D Immunoblot analysis of CYLD expression in DLBCL and MCL cell lines using an antibody raised against a C‐terminal epitope which detects full-length CYLD and a C‐terminal fragment of CYLD (CYLD‐Ct). β-actin was used as a loading control. E Immunoblot analysis of CYLD expression in primary DLBCL and MCL samples. β-actin was used as a loading control.

