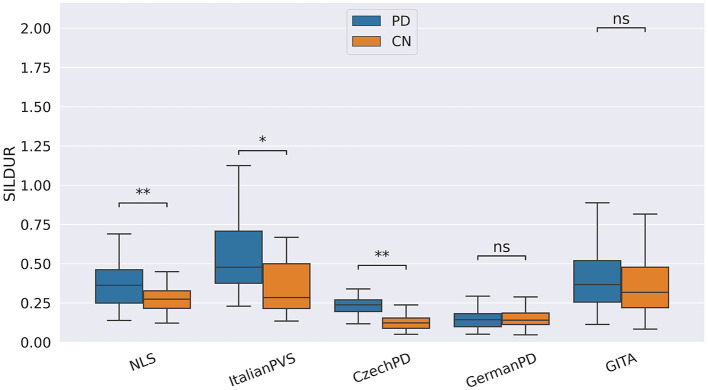
Figure 2.
Boxplots with statistical annotations representing the silence duration (SILDUR) on NLS, Neurovoz, CzechPD, GermanPD, and GITA from the RP task. Horizontal lines represent the median, the top ends represent the upper quartile, and the bottom ends represent the lower quartile. Statistically significant differences between groups after Benjamini–Hochberg correction for SILDUR are reported in Table 5 and highlighted below using asterisks. SILDUR, silence duration; CN, controls; PD, Parkinson's disease; SILDUR, silence duration; SS, spontaneous speech; ns, not significant.

