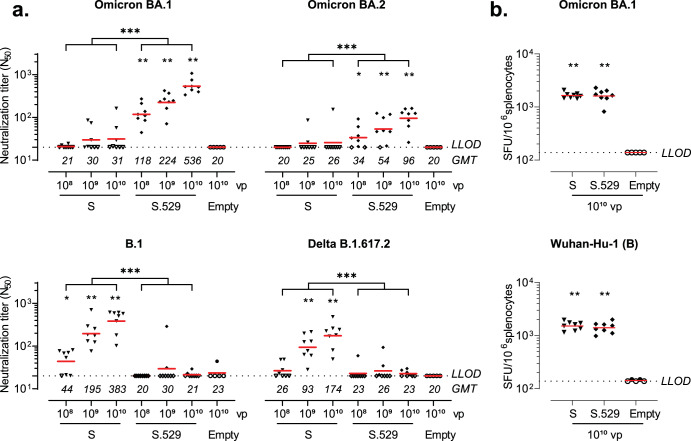
Fig. 4. Neutralizing antibodies and cellular responses induced by Ad26.COV2.S.529 in naive mice.
Mice were vaccinated with 108, 109, 1010 viral particles (vp) Ad26.COV2.S (S) or Ad26.COV2.S.529 (S.529, n = 8 per dose); 1010 vp of the negative control vector Ad26.Empty (Empty, n = 5) at day 0. a Serum was sampled 6 weeks after vaccination to measure neutralizing titers against pseudotyped viruses expressing SARS-CoV-2 B.1, Delta B.1617.2, Omicron BA.1 or BA.2 spike in a pseudotyped virus neutralization assay (psVNA). Neutralizing antibody titers are expressed as the dilution giving a 50% reduction (N50) in the normalized luciferase readout. b Spike protein–specific IFN-γ T cell responses as measured in splenocytes collected 6 weeks after vaccination with 1010 vp S, S.529 or Empty. Spot-forming units (SFU) per 1 × 10⁶ splenocytes are shown. Horizontal red bars per vaccination group represent geometric mean titers (GMT). Dashed horizontal lines represent the lower limit of detection (LLOD). Open symbols indicate the response was at or below LLOD. Comparisons to the mock group were performed by a Mann–Whitney test, comparisons between Ad26.COV2.S and Ad26.COV2.S.529 were performed by a Cochran–Mantel–Haenszel test across dose or a t test. Significance is shown compared with the mock group, unless specified otherwise. Statistical differences are indicated by asterisks: *P < 0.05, **P < 0.01, ***P < 0.001.

