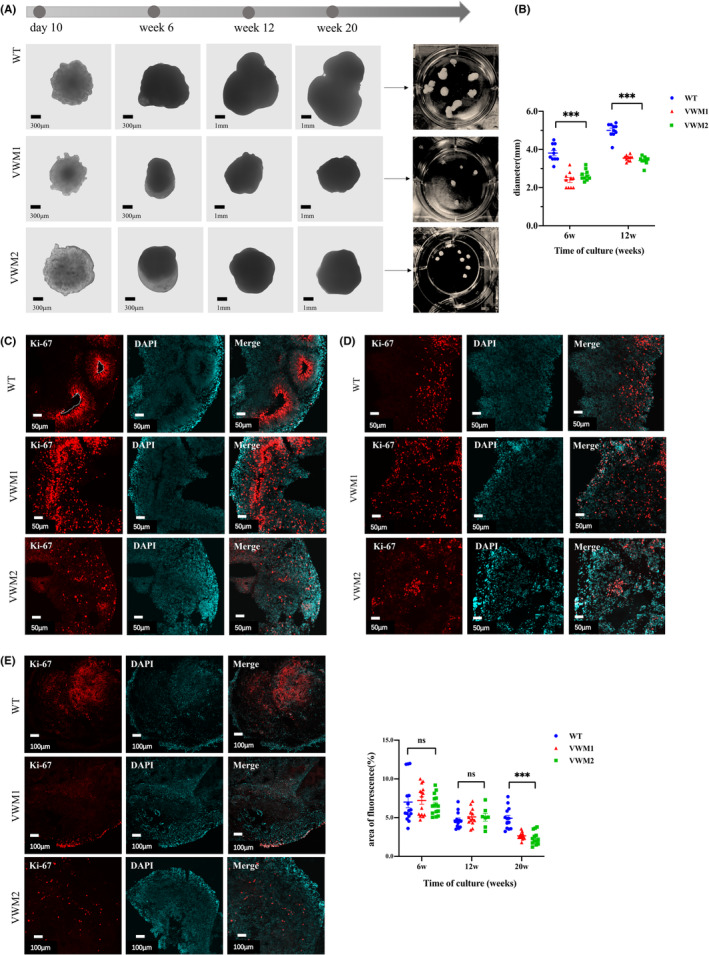
FIGURE 2.

eIF2B mutation resulted in smaller size and showed no difference in proliferation in the early–mid‐stage, but decreased proliferation in later stage in cerebral organoids. (A) Bright‐field images under the microscope of the organoids at different days of maturation. Magnification, scale bar 300 μm and 1 mm. (B) Quantification of the diameter (mm) throughout the entire course of the brain organoid development. Data were presented as mean ± SEM values, n = 10 in each group (numbers were listed within each bar) with three independent experiments; one‐way ANOVA analysis for time point. (C) Immunofluorescence staining for cell proliferation markers Ki‐67(red) localize along the ventricle (enclosed by white dotted line), and nuclear staining (DAPI, blue) at Week 6. Scale bars 50 μm. (D) Immunofluorescence staining for Ki‐67(red), and nuclear staining (DAPI, blue) at Week 12. Scale bars 50 μm. (E) Immunofluorescence staining for Ki‐67(red) and nuclear staining (DAPI, blue) at Week 20. Scale bars 100 μm. Changes in cell proliferation quantified by area of fluorescence of Ki‐67, n = 12–15 in each group (numbers were listed within each bar) with three independent experiments, one‐way ANOVA, and Kruskal–Wallis ANOVA analysis (Week 6, p = 0.767; Week 12, p = 0.624; Week 20, p = 0.000). Data were presented as mean ± SEM values. ns: p > 0.05, ***: p < 0.001.
