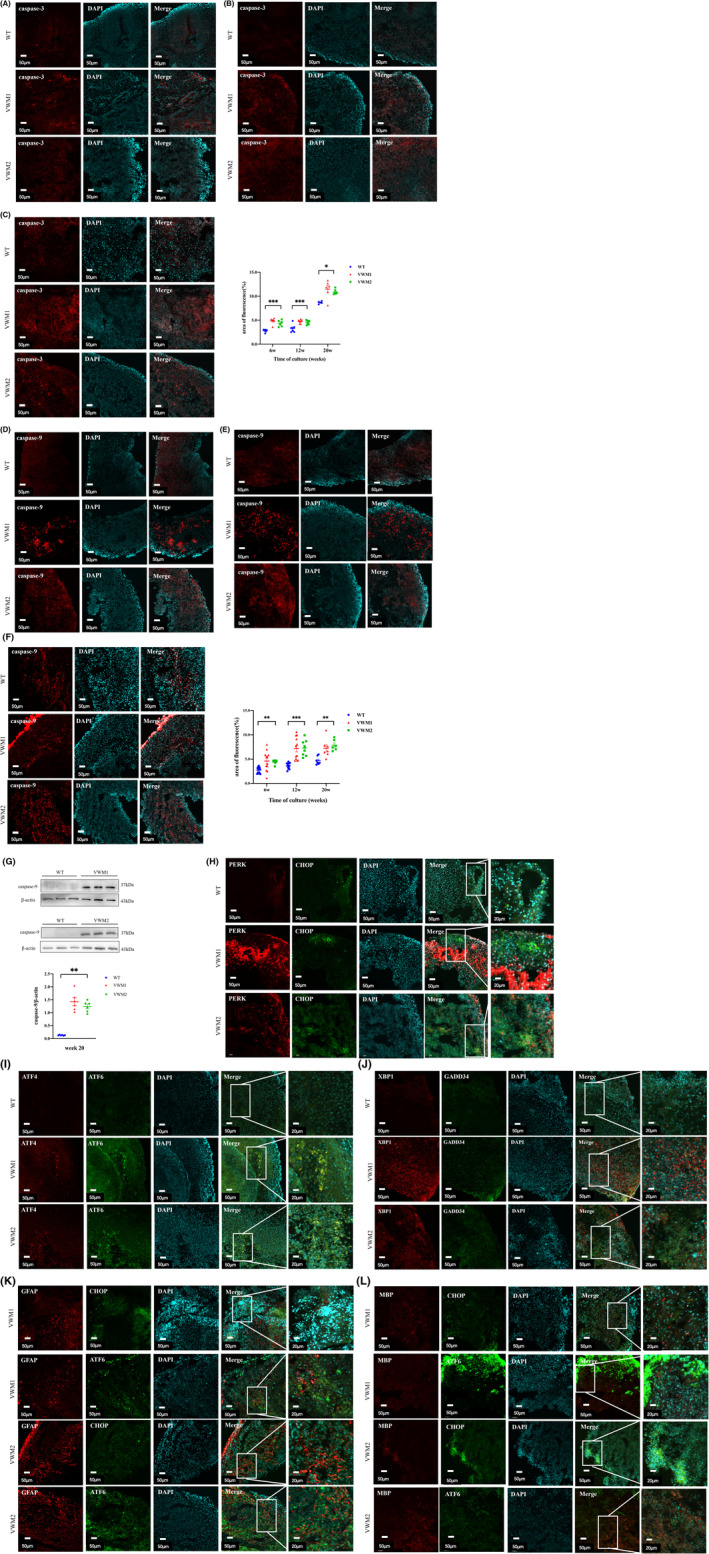
FIGURE 3.

eIF2B mutations led to gradually increased apoptosis of cerebral organoids and UPR signaling pathway overactivation in cerebral organoids. (A) Immunofluorescence staining for cell apoptosis marker caspase‐3(red) and nuclear staining (DAPI, blue) at Week 6. Scale bars 50 μm. (B) Immunofluorescence staining for caspase‐3(red) and nuclear staining (DAPI, blue) at Week 12. Scale bars 50 μm. (C) Immunofluorescence staining for caspase‐3(red) and nuclear staining (DAPI, blue) at Week 20. Scale bars 50 μm. Changes in cell apoptosis quantified by area of fluorescence of caspase‐3, n = 5–7 in each group (numbers were listed within each bar) with three independent experiments, one‐way ANOVA analysis (Week 6, p = 0.000; Week 12, p = 0.000; Week 20, p = 0.021). (D) Immunofluorescence staining for cell apoptosis marker caspase‐9(red) and nuclear staining (DAPI, blue) at Week 6. Scale bars 50 μm. (E) Immunofluorescence staining for caspase‐9(red) and nuclear staining (DAPI, blue) at Week 12. Scale bars 50 μm. (F) Immunofluorescence staining for caspase‐9(red) and nuclear staining (DAPI, blue) at Week 20. Scale bars 50 μm. Changes in cell apoptosis quantified by area of fluorescence of caspase‐9, n = 6–12 in each group (numbers were listed within each bar) with three independent experiments, one‐way ANOVA, and Kruskal–Wallis ANOVA analysis (Week 6, p = 0.004; Week 12, p = 0.000; Week 20, p = 0.001). (G) Western blotting and qualification of the level of caspase‐9 in cerebral organoids with three independent experiments at Week 20, n = 6 in each group (numbers were listed within each bar) with three independent experiments, Kruskal–Wallis analysis. (H) Immunofluorescence staining for PERK(red), CHOP(green), and nuclear staining (DAPI, blue) at Week 20. Scale bars 50 μm. (I) Immunofluorescence staining for ATF4(red), ATF6(green), and nuclear staining (DAPI, blue) at Week 20. Scale bars 50 μm. (J) Immunofluorescence staining for XBP1(red), GADD34(green), and nuclear staining (DAPI, blue) at Week 20. Scale bars 50 μm. (K) Immunofluorescence staining for marker of astrocytes (GFAP, red) and marker of UPR signaling pathway (CHOP, or ATF6, green), and nuclear staining (DAPI, blue) at Week 20. Scale bars 50 μm. (L) Immunofluorescence staining for marker of oligodendrocytes (MBP, red) and marker of UPR signaling pathway (CHOP, or ATF6, green) and nuclear staining (DAPI, blue) at Week 20. Scale bars 50 μm. Data were presented as mean ± SEM values. *: denotes p < 0.05, **: denotes p < 0.01, ***: denotes p < 0.001.
