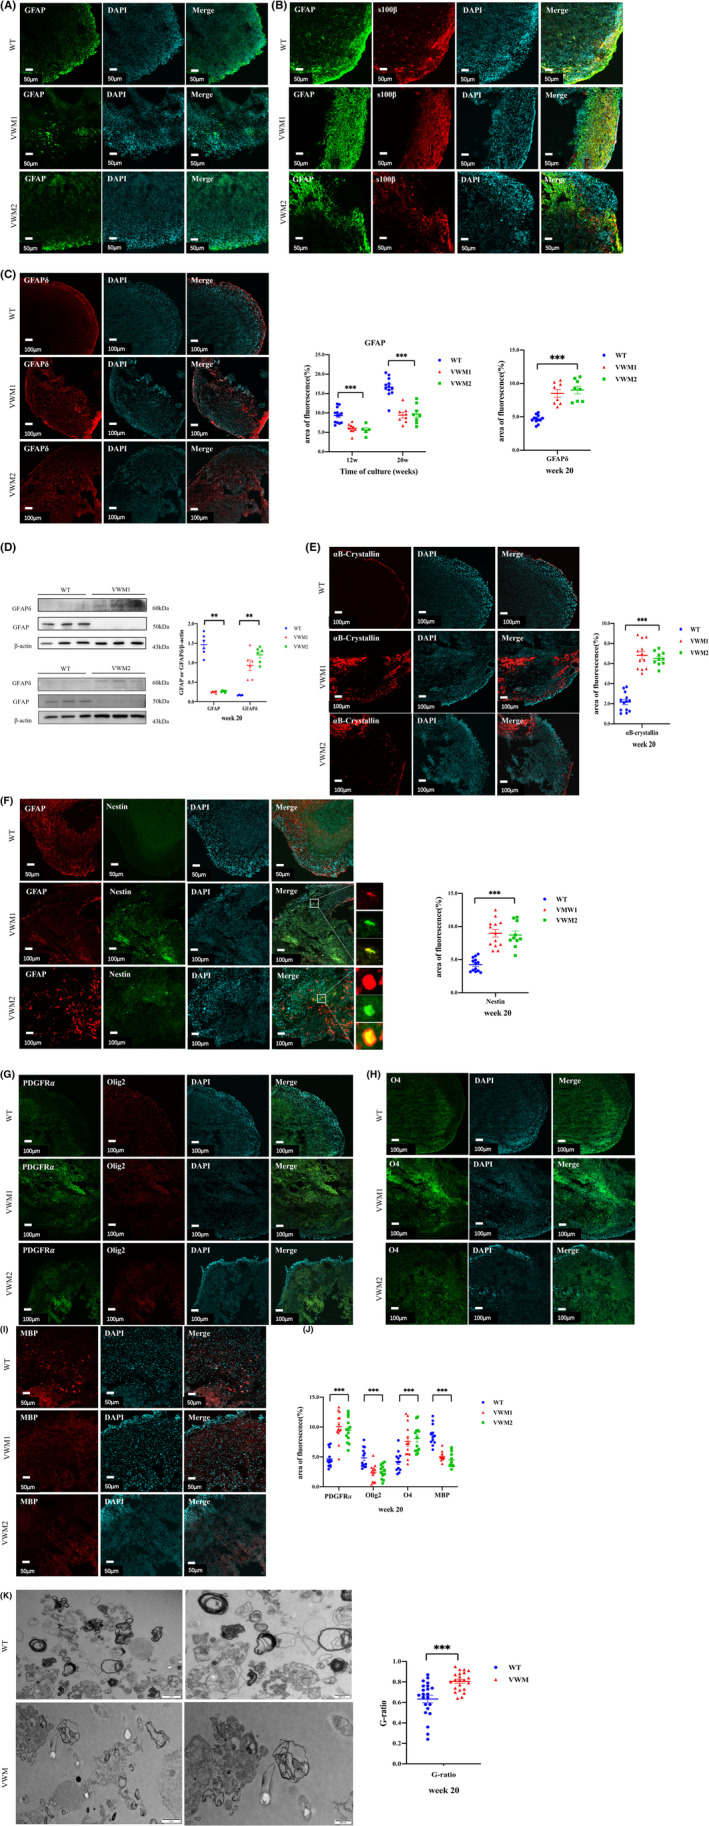
FIGURE 5.

eIF2B mutation resulted in impaired differentiation of astrocytes and oligodendrocytes. (A) Immunofluorescence staining for marker of astrocytes (GFAP, green) and nuclear staining (DAPI, blue) at Week 12. Scale bars 50 μm. (B) Immunofluorescence staining for markers of astrocytes (GFAP, green and s100β, red) and nuclear staining (DAPI, blue) at Week 20. Scale bars 50 μm. Changes in astrocytes quantified by area of fluorescence of GFAP, n = 8–12 in each group with three independent experiments, one‐way ANOVA analysis (Week 12: p = 0.000; Week 20: p = 0.000). (C) Immunofluorescence staining for the abnormal isomer GFAPδ(red) of astrocytes and nuclear staining (DAPI, blue) at Week 20. Scale bars 50 μm. Change in abnormal astrocytes quantified by area of fluorescence of GFAPδ, n = 8–12 in each group with three independent experiments, one‐way ANOVA analysis (p = 0.000). (D) Western blotting and qualification of the level of GFAP and GFAPδ in cerebral organoids with three independent experiments at Week 20, n = 6 in each group (numbers were listed within each bar) with three independent experiments, Kruskal–Wallis analysis. (E) Immunofluorescence staining for the abnormal marker of astrocytes αB‐crystallin (red) and nuclear staining (DAPI, blue) at Week 20. Scale bars 100 μm. Change in abnormal astrocytes quantified by area of fluorescence of αB‐crystallin, n = 10–13 in each group with three independent experiments, one‐way ANOVA analysis (p = 0.000). (F) Immunofluorescence staining for the immature marker nestin(green) of astrocytes and nuclear staining (DAPI, blue) at Week 20. Scale bars 50 μm. Change in abnormal astrocytes quantified by area of fluorescence of nestin, n = 10–13 in each group with three independent experiments, one‐way ANOVA analysis (p = 0.000). (G) Immunofluorescence staining for the marker of OPCs (PDGFRα, green), mature oligodendrocytes (Olig2, red), and nuclear staining (DAPI, blue) at Week 20. Scale bars 100 μm. (H) Immunofluorescence staining for the immature marker of oligodendrocytes (O4, green) and nuclear staining (DAPI, blue) at Week 20. Scale bars 100 μm. (I) Immunofluorescence staining for the mature marker of oligodendrocytes (MBP, red), and nuclear staining (DAPI, blue) at Week 20. Scale bars 100 μm. (J) Change in OPCs quantified by area of fluorescence of PDGFRα, n = 13 in each group with three independent experiments, one‐way ANOVA analysis (p = 0.000). Changes in oligodendrocytes quantified by area of fluorescence of Olig2, O4, and MBP, n = 12–13 in each group with three independent experiments, one‐way ANOVA analysis (Olig2: p = 0.000; O4: p = 0.000; MBP: p = 0.000). (K) Transmission electron microscopy showed the myelin sheath. Scale bars 1 μm (left), 500 nm (right). Quantification of G‐ratio at Week 20. Mann–Whitney U‐test analysis (p = 0.000). OPC: oligodendrocyte precursor cells. Data were presented as mean ± SEM values, **: p < 0.01, ***: p < 0.001.
