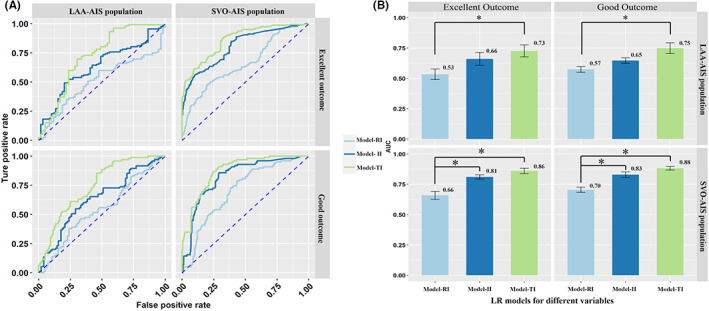
FIGURE 1.

The mean ± 95% CI of the receiver operating characteristic area under the curve (AUC) is displayed as a bar graph in SVO and LAA AIS patients. The prediction models built with TI and II were found to be significantly better than the models built with RI both in SVO and LAA population. (A) the AUC of LR model with various combination of input in SVO and LAA AIS population for different outcome; (B) The differences between LR models of different input. AIS, acute ischemic stroke; AUC, area under curve; II, image index; LAA, large artery atherosclerosis; RI, regular index; SVO, small vessel occlusion; TI, total index.
