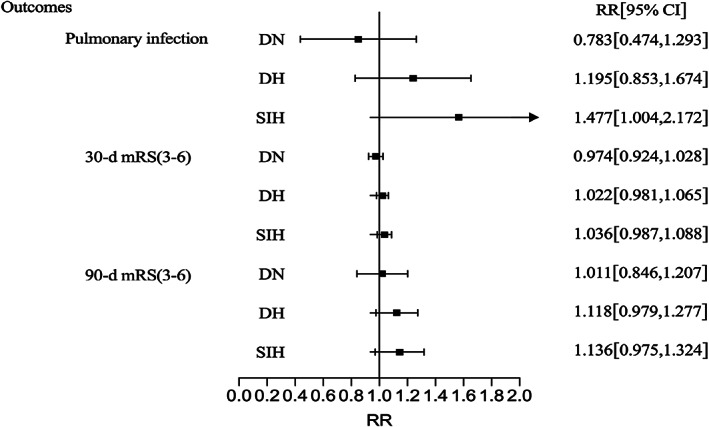
FIGURE 2.

Multivariate regression analysis of ICH poor outcomes of different subgroups. Adjusted: Adjusted for age, sex, time from symptom onset to admission, infratentorial hemorrhage, hematoma volume, GCS, IVH, hypertension history, and surgical treatment. DH, diabetic hyperglycemia; DN, diabetic normoglycemia; SIH, stress‐induced hyperglycemia.
