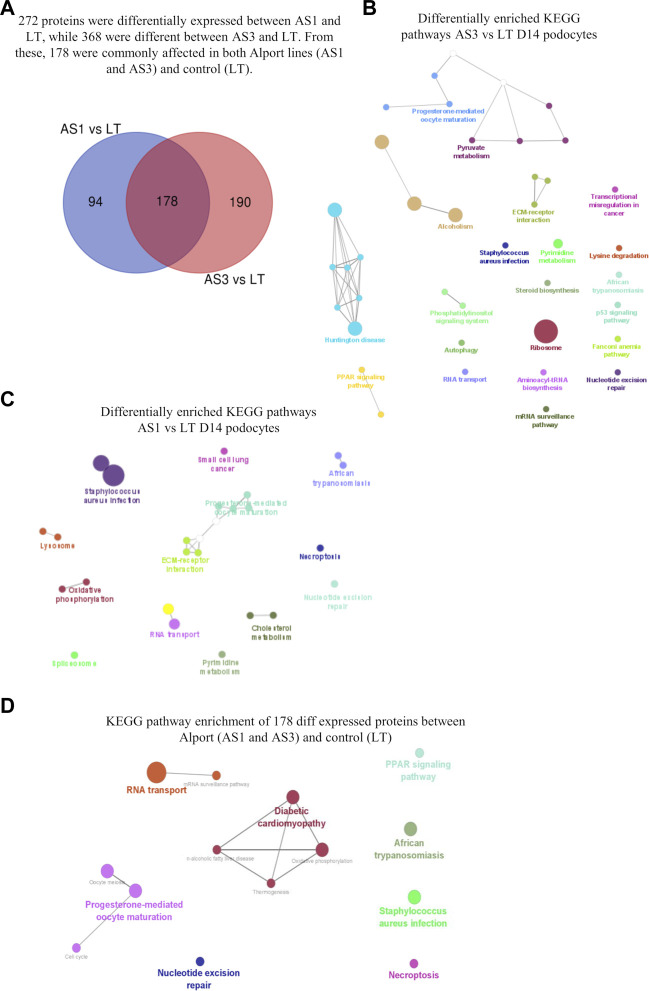
FIGURE 3.
Proteomic analysis comparison of hiPSC-derived D14 podocytes from Alport disease (AS1 and AS3) and normal patients (LT) cell lines. In (A), the Venn diagram highlighting the differentially expressed proteins from each comparison and those commonly affected in both Alport cell lines. The enriched KEGG pathways identified from the differentially expressed proteins between AS3 and LT (B), AS1 and LT (C) and Both AS1 and AS3 vs. LT (D). The analysis was performed using Cytoscape v 3.9.1 and its plug-in Cluego using the set of proteins differentially expressed (p < 0.05) referred in each comparison.

