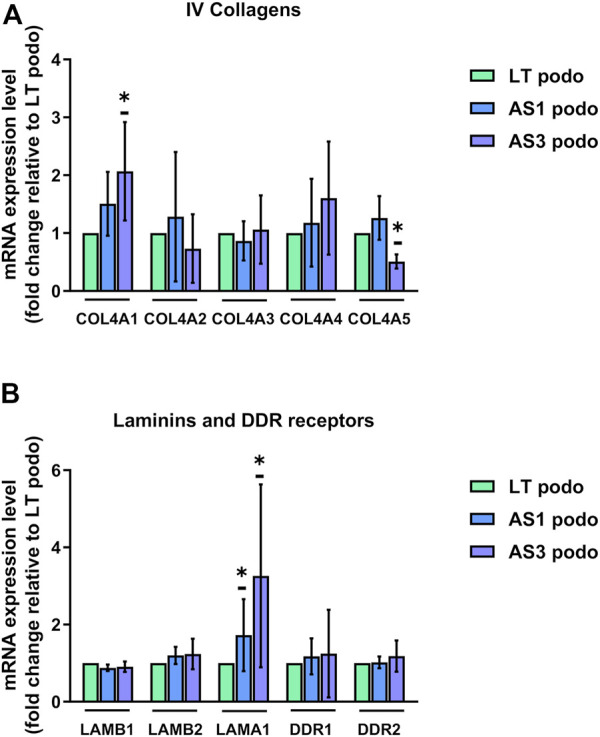
FIGURE 5.

mRNA expression LT vs. Alport podocytes. In (A), mRNA expression of COL4A1, COL4A2, COL4A3, COL4A4, and COL4A5 was analyzed using Q-PCR in Day 14 podocytes from the three cell lines and normalized to the expression level found in LT control podocytes for each experiment. (B), relative mRNA expression of glomerular basement membrane laminins LAMB1, LAMB2, and LAMA1, and collagen receptors DDR1 and DDR2. Significance was tested by an unpaired t-test. Asterisk denotes statistically significant differences compared to LT control podocytes,*p < 0.05, n = 4.
