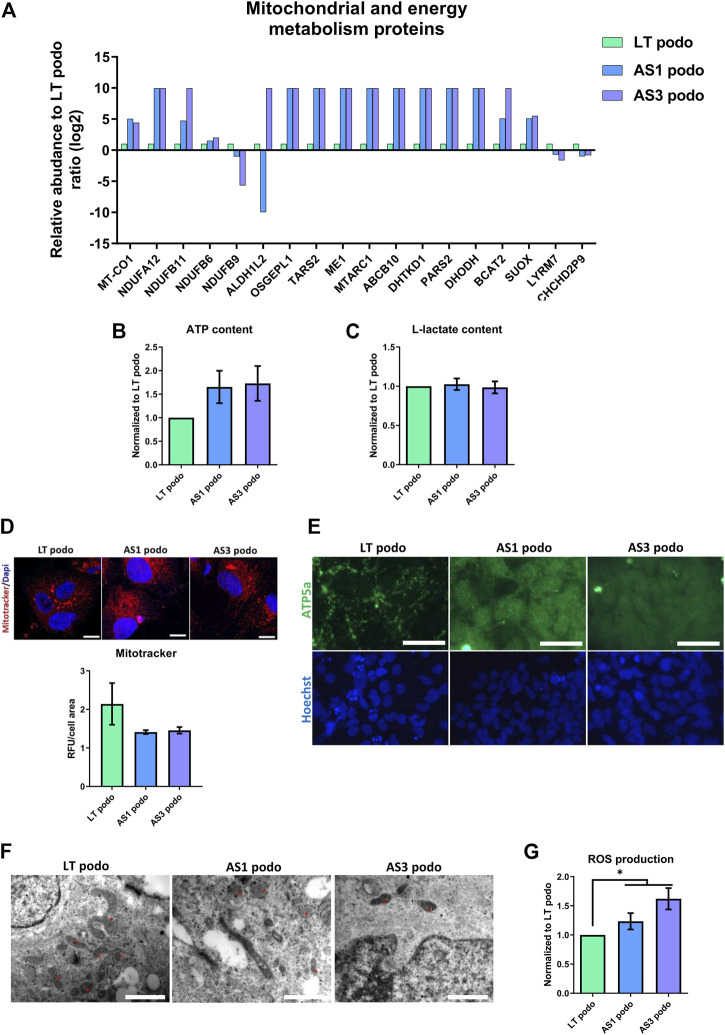
FIGURE 6.
Metabolism in Alport Day 14 podocytes. In (A), several proteins involved in mitochondrial metabolism were dysregulated in Alport cell lines. No statistical difference was observed in ATP content (B), L-Lactate production (C) or mitochondrial membrane potential (IF, scale bar 20 μm, the MitoTracker fluorescent intensity was normalized over cells area for quantification) (D). However, mitochondrial morphology varied among the cell lines, as demonstrated by ATPase IF, scale bar 50 µm (E), and electron microscopy (F). In EM the morphology of mitochondria (asterisks) in the different cell lines is highlighted; magnification 250,00X for LT podo and 200,00x for AS podo figure, scale bar respectively 400 nm and 500 nm. Alport cell lines produced more reactive oxygen species than LT control podocytes (G). Significance was tested by an unpaired t-test. Asterisk denotes statistically significant differences compared to LT control podocytes,*p < 0.05, n = 9.

