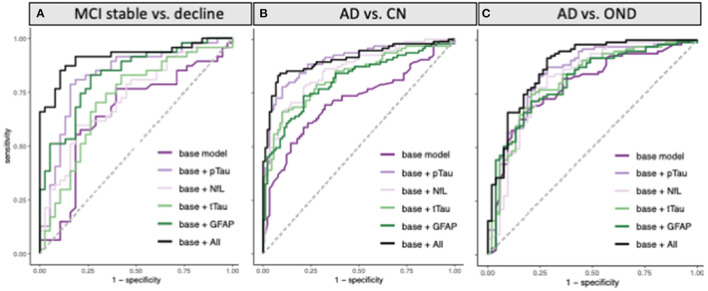
Figure 4.
ROC curves for classification of (A) MCI participants who progressed to a consensus diagnosis of AD dementia during 4 years of follow-up (MCI decline) vs. participants who remained stable during follow-up (MCI stable). (B) AD vs. cognitively normal controls (CN), and (C) AD vs. other neurodegenerative diseases (OND) using pTau181, tTau, NfL, and GFAP alone or all combined in addition to a base model containing age, sex, and APOE status.

