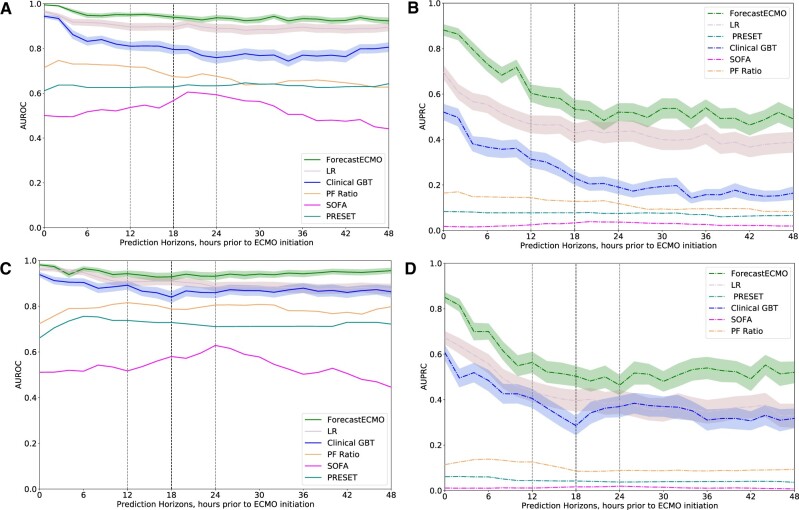
Figure 3.
Prediction models performance. (A) Development cohort: area under ROC at prediction horizons of 0–48 h prior to ECMO initiation or hospital discharge for ForecastECMO, Clinical GBT, PF ratio LR, LR model of all included variables, SOFA score, and PRESET score LR models. The ForecastECMO model outperformed the Clinical GBT, PF, SOFA, and PRESET score models at all prediction horizons. The linear LR model performed similar to ForecastECMO at many of the studied prediction horizons. During the 12–24-h prediction horizons (light dotted line), ForecastECMO had the highest performance at the 18-h prediction horizons (dark dotted line) compared to the remaining models. (B) Development cohort: area under PRC curve at prediction horizons of 0 to 48 hours prior to ECMO initiation or hospital discharge for ForecastECMO, Clinical GBT, PF ratio LR, LR model of all included variables, SOFA score, and PRESET score LR models. The ForecastECMO model outperformed all the compared models at all the studied prediction horizons with high performance at the 18-h prediction horizon (dark dotted lines) in the 12-24-h prediction horizon range (light dotted lines). (C) Holdout cohort: area under ROC at prediction horizons of 0–48 h prior to ECMO initiation or hospital discharge for ForecastECMO, Clinical GBT, PF ratio LR, LR model of all included variables, SOFA score, and PRESET score LR models. The ForecastECMO model outperformed all the comparable models including the linear LR at all prediction horizons. Of note, compared to the development cohort, the PRESET score LR model outperformed the SOFA score LR model at all the studied prediction horizons. The ForecastECMO maximal performance in the 12–24-h prediction horizons range (light dotted lines) was at 18 h (dark dotted line). (D) Holdout cohort: area under PRC curve at prediction horizons of 0–48 h prior to ECMO initiation or hospital discharge for ForecastECMO, Clinical GBT, PF ratio LR, LR model of all included variables, SOFA score, and PRESET score LR models. The ForecastECMO model outperformed all the compared models at all the studied prediction horizons. In the 12–24-h prediction horizons (light dotted lines), ForecastECMO continued to have high performance at 18 h (dark dotted line) compared to the other models. ECMO: extracorporeal membrane oxygenation; GBT: Gradient Boosting Tree; ICU: intensive care unit; LR: logistic regression; PF: PaO2/FiO2; PRC: precision recall curve; PRESET: PREdiction of Survival on ECMO Therapy; ROC: receiver operator curve; SOFA: Sequential Organ Failure Assessment.

