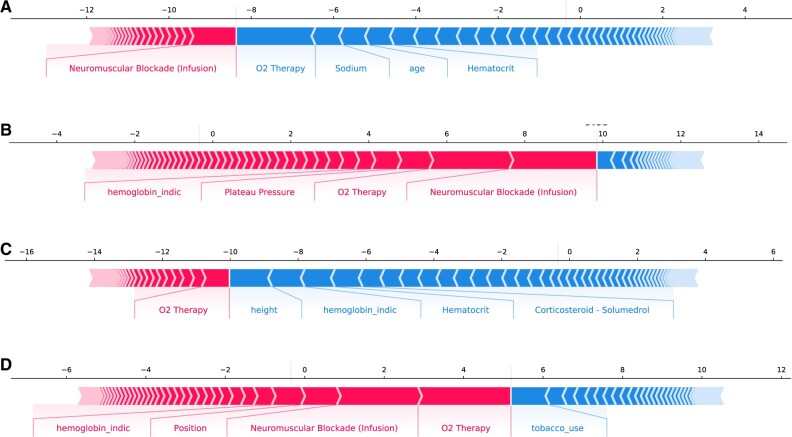
Figure 6.
ForecastECMO prediction performance by force plots. (A) Force plot for prediction of ECMO utilization in a patient who did not receive ECMO in the development cohort. Features contributing most to the negative prediction by SHAP analysis included oxygen therapy, measurement of blood sodium level, patient age, and measurement of blood hematocrit concentration. (B) Force plot for the prediction of ECMO utilization in a patient who received ECMO support in the development cohort. Features contributing most to the positive prediction by SHAP analysis included the use of neuromuscular blockade infusion, supplemental oxygen therapy, plateau pressure measurement on invasive mechanical ventilation, and measurement of hemoglobin level. (C) Force plot for prediction of ECMO utilization in a patient who did not receive ECMO in the holdout cohort. Features contributing most to the negative prediction included the patient’s height, measurement of hemoglobin level, measurement of hematocrit concentration, and use of systemic corticosteroids. ECMO: extracorporeal membrane oxygenation; CPAP: continuous positive airway pressure; GCS: Glasgow coma scale; O2: oxygen; PEEP: positive end-expiratory pressure; PLR: platelet-to-lymphocyte ratio; SHAP: SHapley Additive exPlanations.

