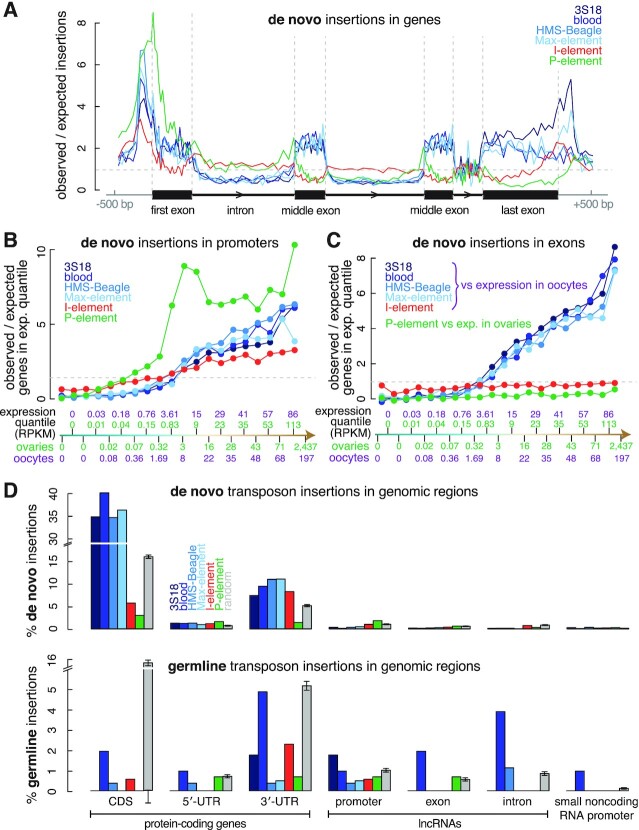
Figure 3.
The preference of transposon insertions correlates with gene activity. (A) Meta analysis quantifying the average enrichment of transposon insertions in the ±500 bp window surrounding protein-coding genes. We divided the entire region into 160 bins, with ten bins each for the upstream and downstream 500-bp regions and 20 bins each for the first exon, the first intron, the first intermediate exon, the last intermediate intron, the last intermediate exon, the last intron and the last exon. The first exon, first intron, middle exon, last intron and last exon in our schematic are drawn in proportion to their average sizes in the fly genome. (B, C) Protein-coding genes were divided into 20 equal-sized sets by expression level in ovaries (for comparison with P-element insertions) and oocytes (for comparison with LTR transposon and I-element insertions). Enrichment of transposon insertions in the promoters or exons in each of the 20 quantiles is shown in ascending order of transcription level. Each quantile contains 697 genes; their average expression levels in ovaries and oocytes are provided in RPKM (reads per kilobase pair per million aligned reads). (D) Barplots depicting the percentage of de novo and germline transposon insertions in the CDS, 5′-UTR and 3′-UTR of protein-coding genes; the promoter, exon and intron of lncRNAs; and the promoter of small ncRNAs. Error bars indicate the standard deviations of random insertions. The percentages of observed insertions were compared with random insertions in each type of genomic element. All observed insertions differ significantly from random insertions in each type of genomic element (multiple testing corrected t-test q-values < 0.05).

