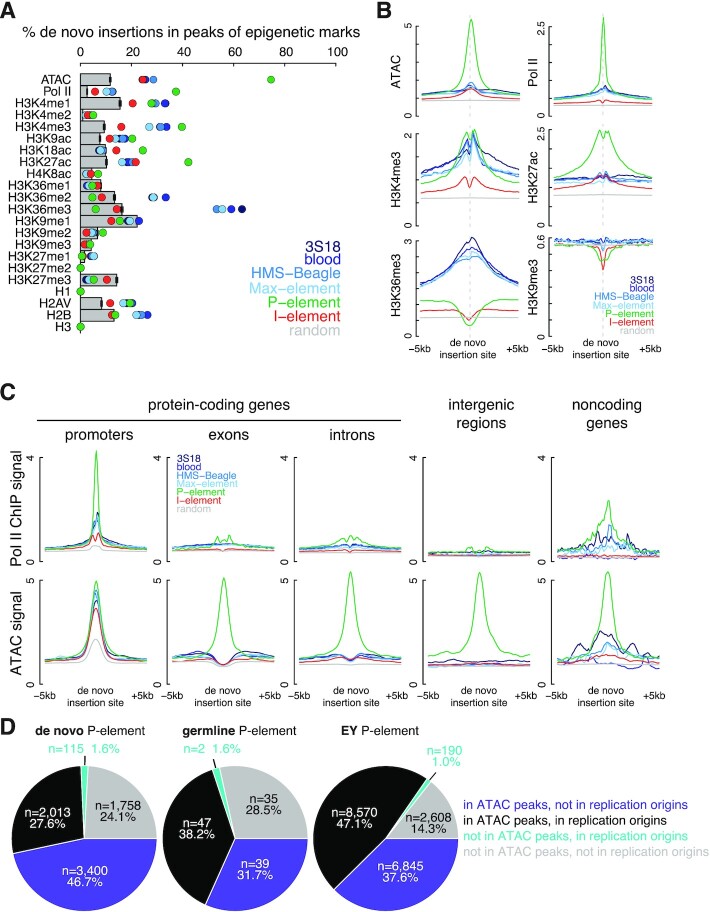
Figure 4.
Chromatin accessibility defines insertion sites of P-elements. (A) Percentage of insertions in the peaks of ATAC-seq and the ChIP-seq data of Pol II, H3K4me1–3, H3K9ac, H3K18ac, H3K27ac, H4K8ac, H3K36me1–3, H3K9me1–3, H3K27me1–3, H1, H2AV, H2B and H3 identified in the respective samples. Observed insertions are illustrated as colored dots, and random insertions as gray bars. Error bars represent the standard deviation of random insertions. (B) Normalized signal of ATAC-seq and fold enrichment over input of Pol II, H3K4me3, H3K27ac, H3K36me3 and H3K9me3 ChIP-seq data are shown for the ±5 kb window centered on transposon insertions. (C) Normalized Pol II ChIP-seq and ATAC-seq signals are shown for the ±5 kb window centered on transposon insertions stratified into five groups: in the promoters of protein-coding genes, in the exons or introns of protein-coding genes, in intergenic regions, and in the promoters or bodies of noncoding genes. (D) The percentages of de novo P-element, germline P-element, and EY P-element insertions localized to ATAC and replication origins, representing open chromatic and origins of replication, respectively.

