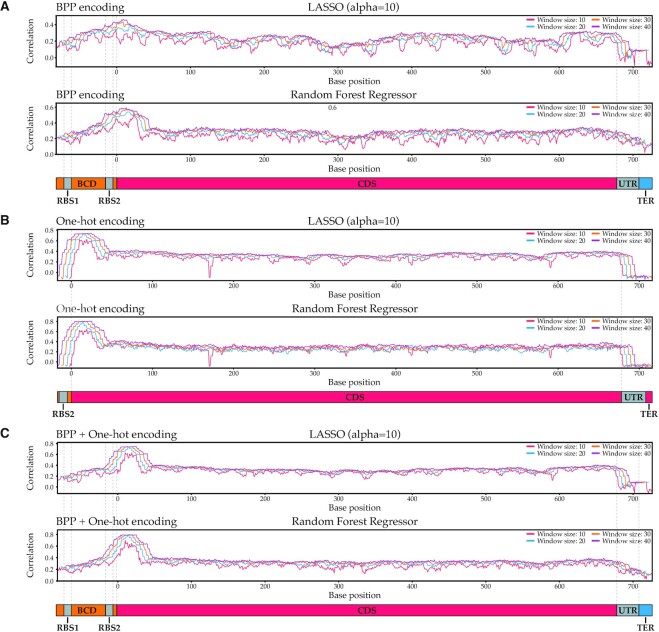
Figure 6.
Predictive regions of translation efficiency in mRFP mRNA. The x-axis represents the central base of a sliding window of indicated lengths, the y-axis the correlation between actual expression data and the expression as predicted by a machine learning algorithm trained on solely that sliding window. (A) Predictive regions found by algorithms trained with BPP featurization. (B) Predictive regions found by algorithms trained with one-hot encoding. As the one-hot encoded features for the UTRs are constant and thus contain no predictive information, windows that only contain residues in the UTR were omitted. (C) Predictive regions found by algorithms trained with BPP + one-hot featurization.

