Figure 1.
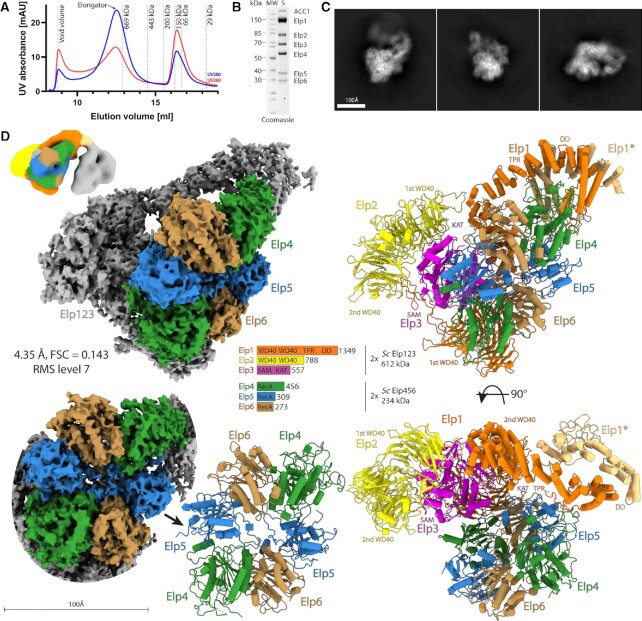
Cryo-EM structure of yeast Elongator. (A) Purification chromatogram profile of yeast Elongator. Red and blue lines represent UV260 and UV280 absorbance, respectively. The peak corresponding to Elongator is indicated with a black arrow. (B) SDS-PAGE representing the final purification quality of the Elongator sample. (C) Reference-free 2D class averages of yeast Elongator data set, scale bar 100 Å. (D) Cryo-EM reconstruction of yeast Elongator at 4.35 Å resolution visualized at indicated map contouring with the atomic model at two orientations (upper and lower right). A schematic representation of the complex is shown in the middle with Elp456 highlighted in color on the cryo-EM reconstruction and all subunits colored in accordance with the scheme on the atomic model. Front view on the density and atomic model of Elp456 (lower left). Double lobe low-resolution cryo-EM reconstruction of Elongator (upper left), coloring corresponds to the atomic model of native ScElongator.

