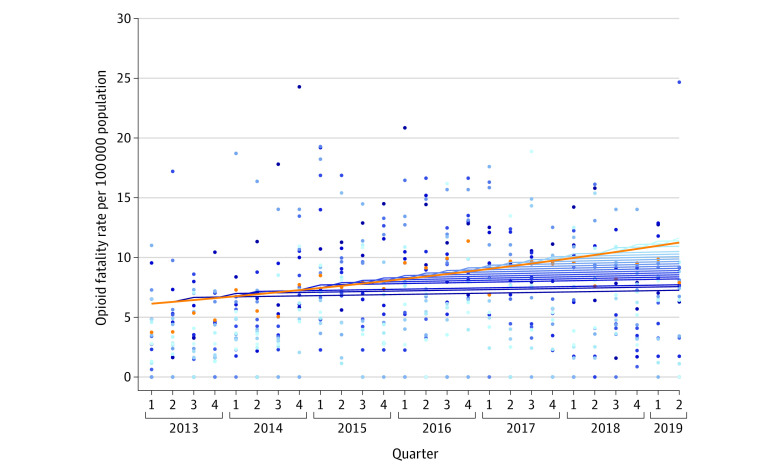
Figure. Quarterly Opioid Fatality Rate Grouped by Implementing Quarters of the Postoverdose Outreach Programs Among 93 Municipalities in Massachusetts From January 2013 Through June 2019.
Ninety-three communities were eligible based on a threshold of 30 overdose-related emergency encounters in 2015. During the study period, 58 municipalities implemented postoverdose outreach programs with varying inception quarters. Municipalities with the same implementing quarters were grouped, and their mean opioid fatality rates over time were plotted using the same shade of blue, with fitted lines indicating preimplementation slope and postimplementation slope. Among the remaining 35 municipalities that did not implement outreach programs or did not provide specific inception information, the mean opioid fatality rates over time were plotted with orange dots with a fitted line.

