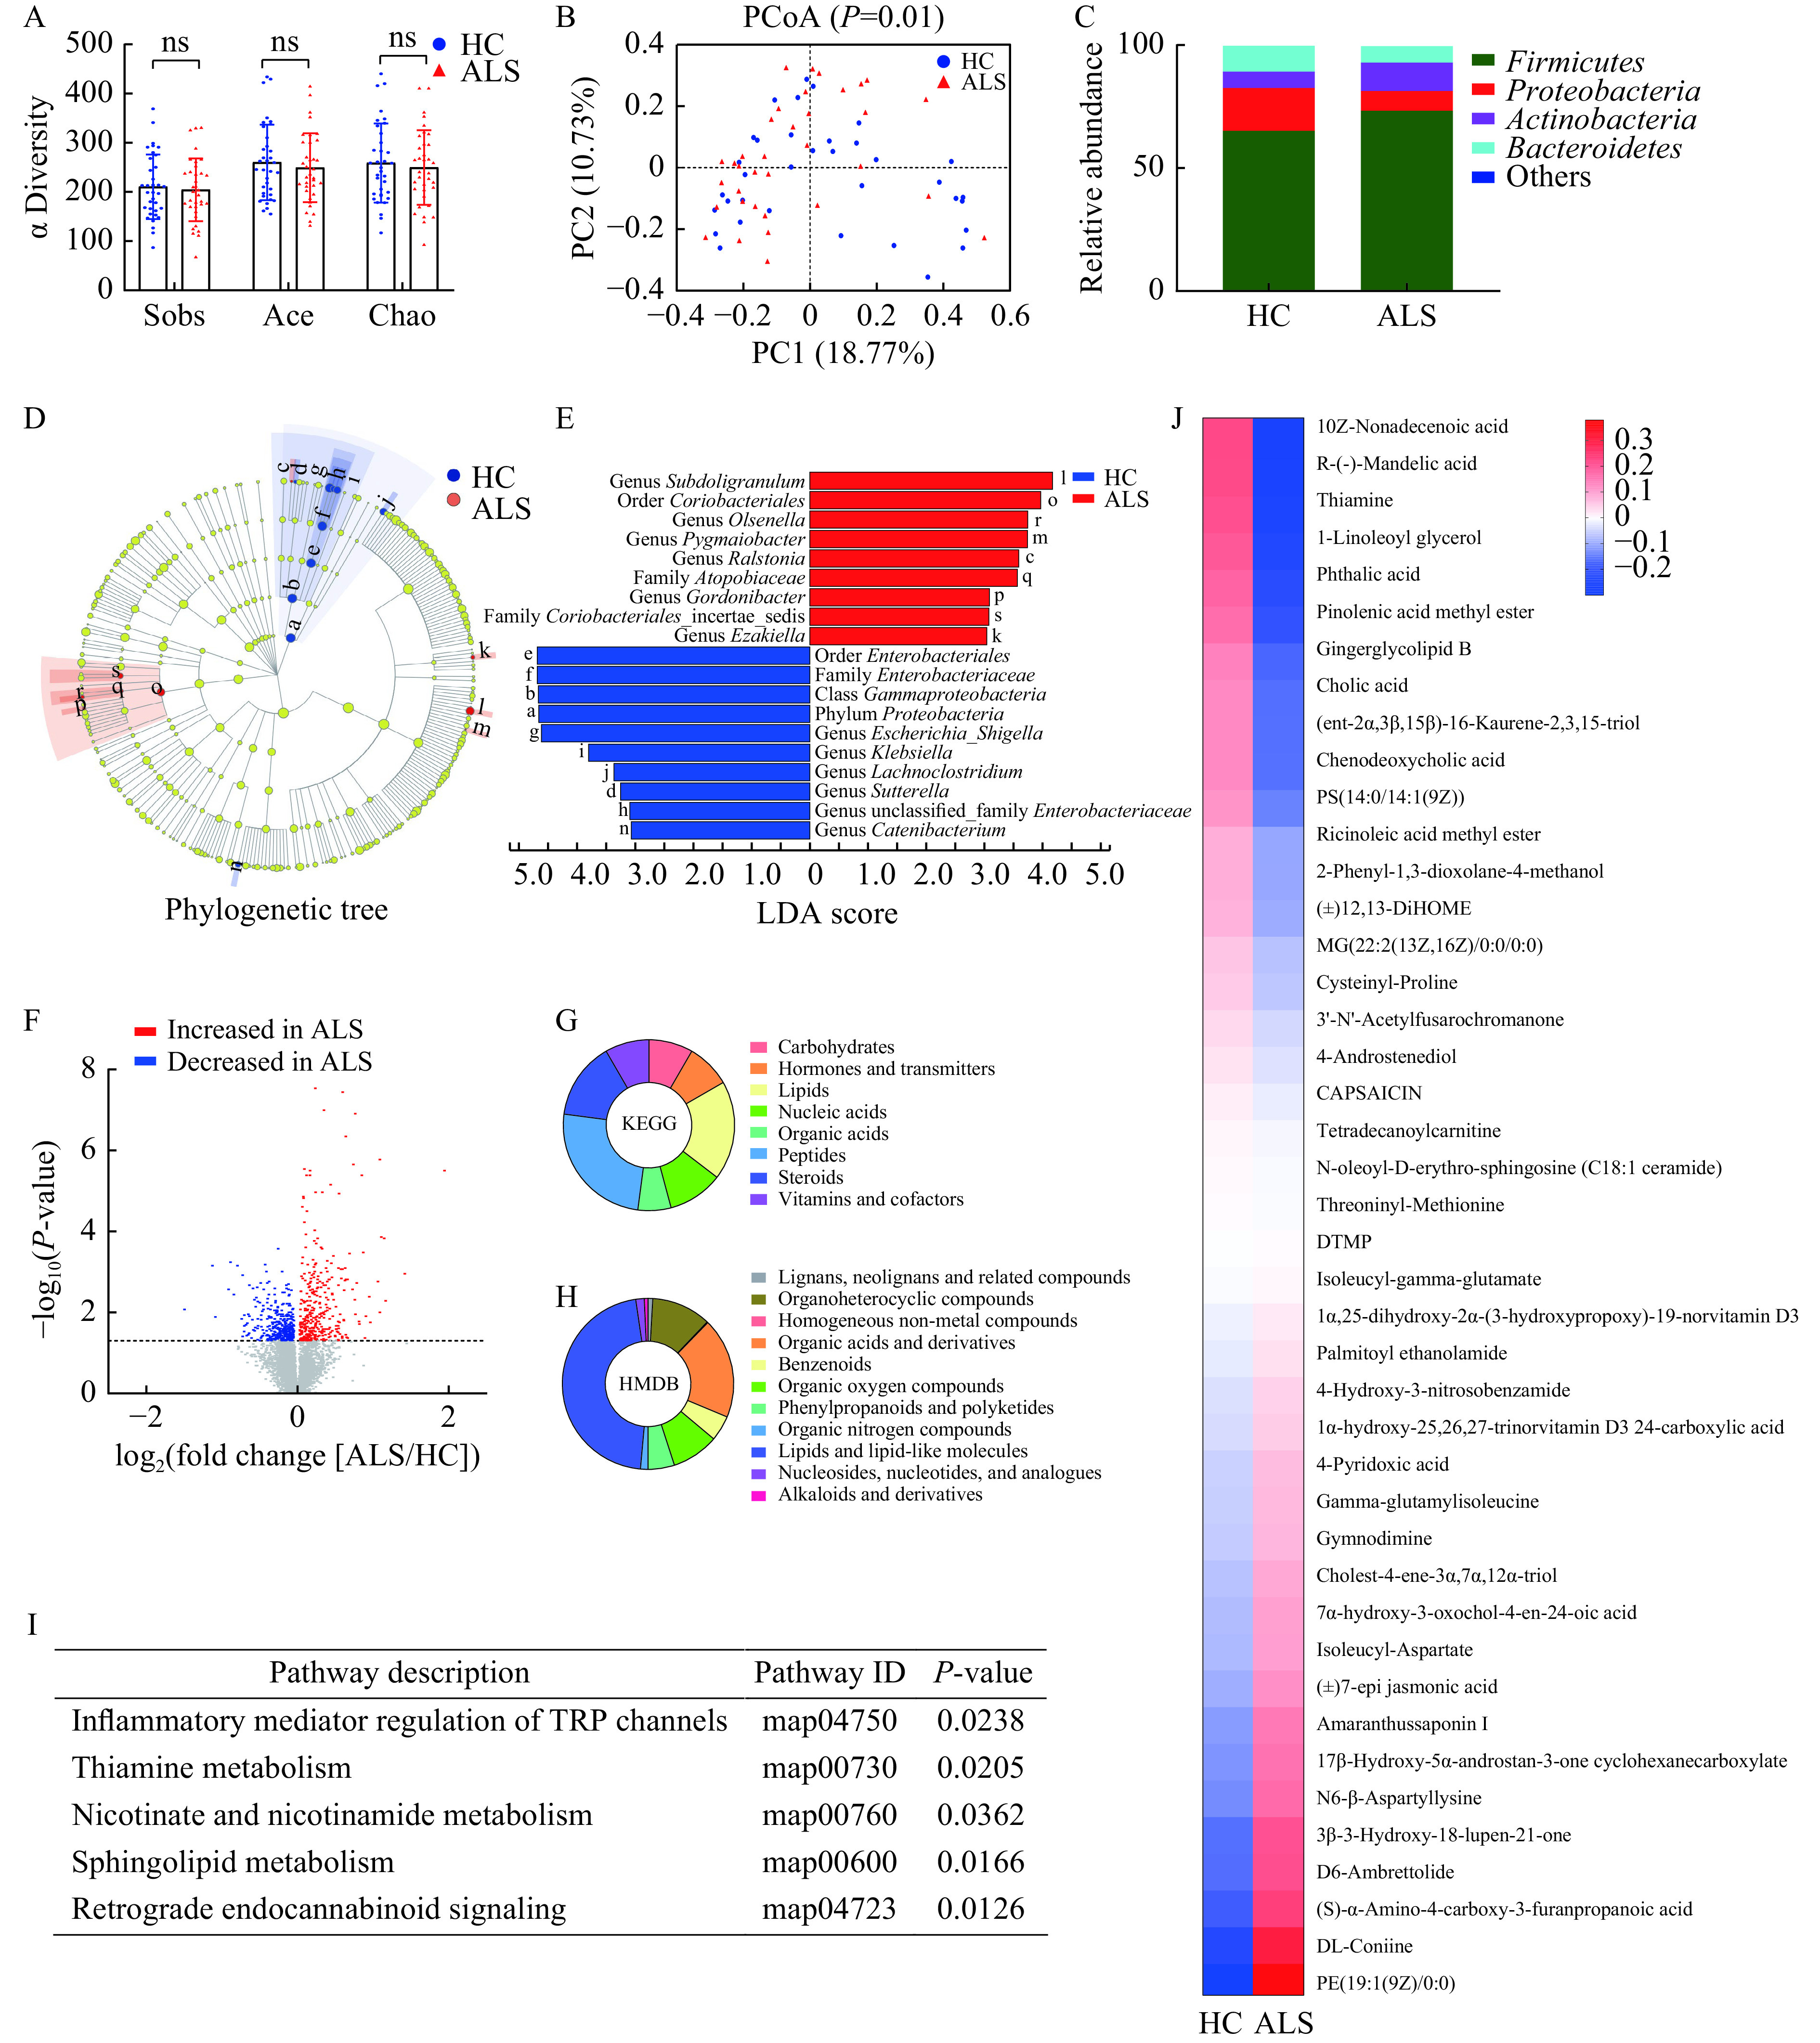
Figure 2. Difference in microbial community and fecal metabolites between ALS patients and healthy controls.

A: Comparison of microbial α diversity (assessed by Sobs, Ace and Chao index). B: Comparison of microbial β diversity (assessed by PCoA). C: Relative abundance of the microbial community at the phylum level. D and E: Distinguishing bacterial taxa identified by LEfSe analysis. Cladogram showing the phylogenetic distribution of the bacterial lineages. Circles indicate phylogenetic levels from domain to genus. The diameter of each circle is proportional to the abundance of the bacterial group (D). The letters show the distinguishing taxa with a LDA score >3 (E). F: Comparison of fecal metabolites. Among 14 108 metabolites detected, 350 increased in ALS (P<0.05), while 339 were reduced in ALS (P<0.05), compared with the HC group. G and H: The classification of 41 distinguishing fecal metabolites (P<0.05, VIP score >1) were identified in database. Compounds with biological roles in KEGG (G). Superclass metabolites in HMDB database (H). I: In KEGG, 41 distinguishing fecal metabolites between ALS and HC were mapped to five metabolic pathways. J: Relative concentrations of 41 distinguishing fecal metabolites (P<0.05, VIP score >1) between ALS and HC. ns: not significant; ALS: amyotrophic lateral sclerosis; HC: healthy controls; PCoA: Principal coordinates analysis; LEfSe: the Linear discriminant analysis of effect size; VIP: Variable Importance in the Projection; KEGG: Kyoto Encyclopedia of Genes and Genomes; HMDB: Human Metabolome Database.
