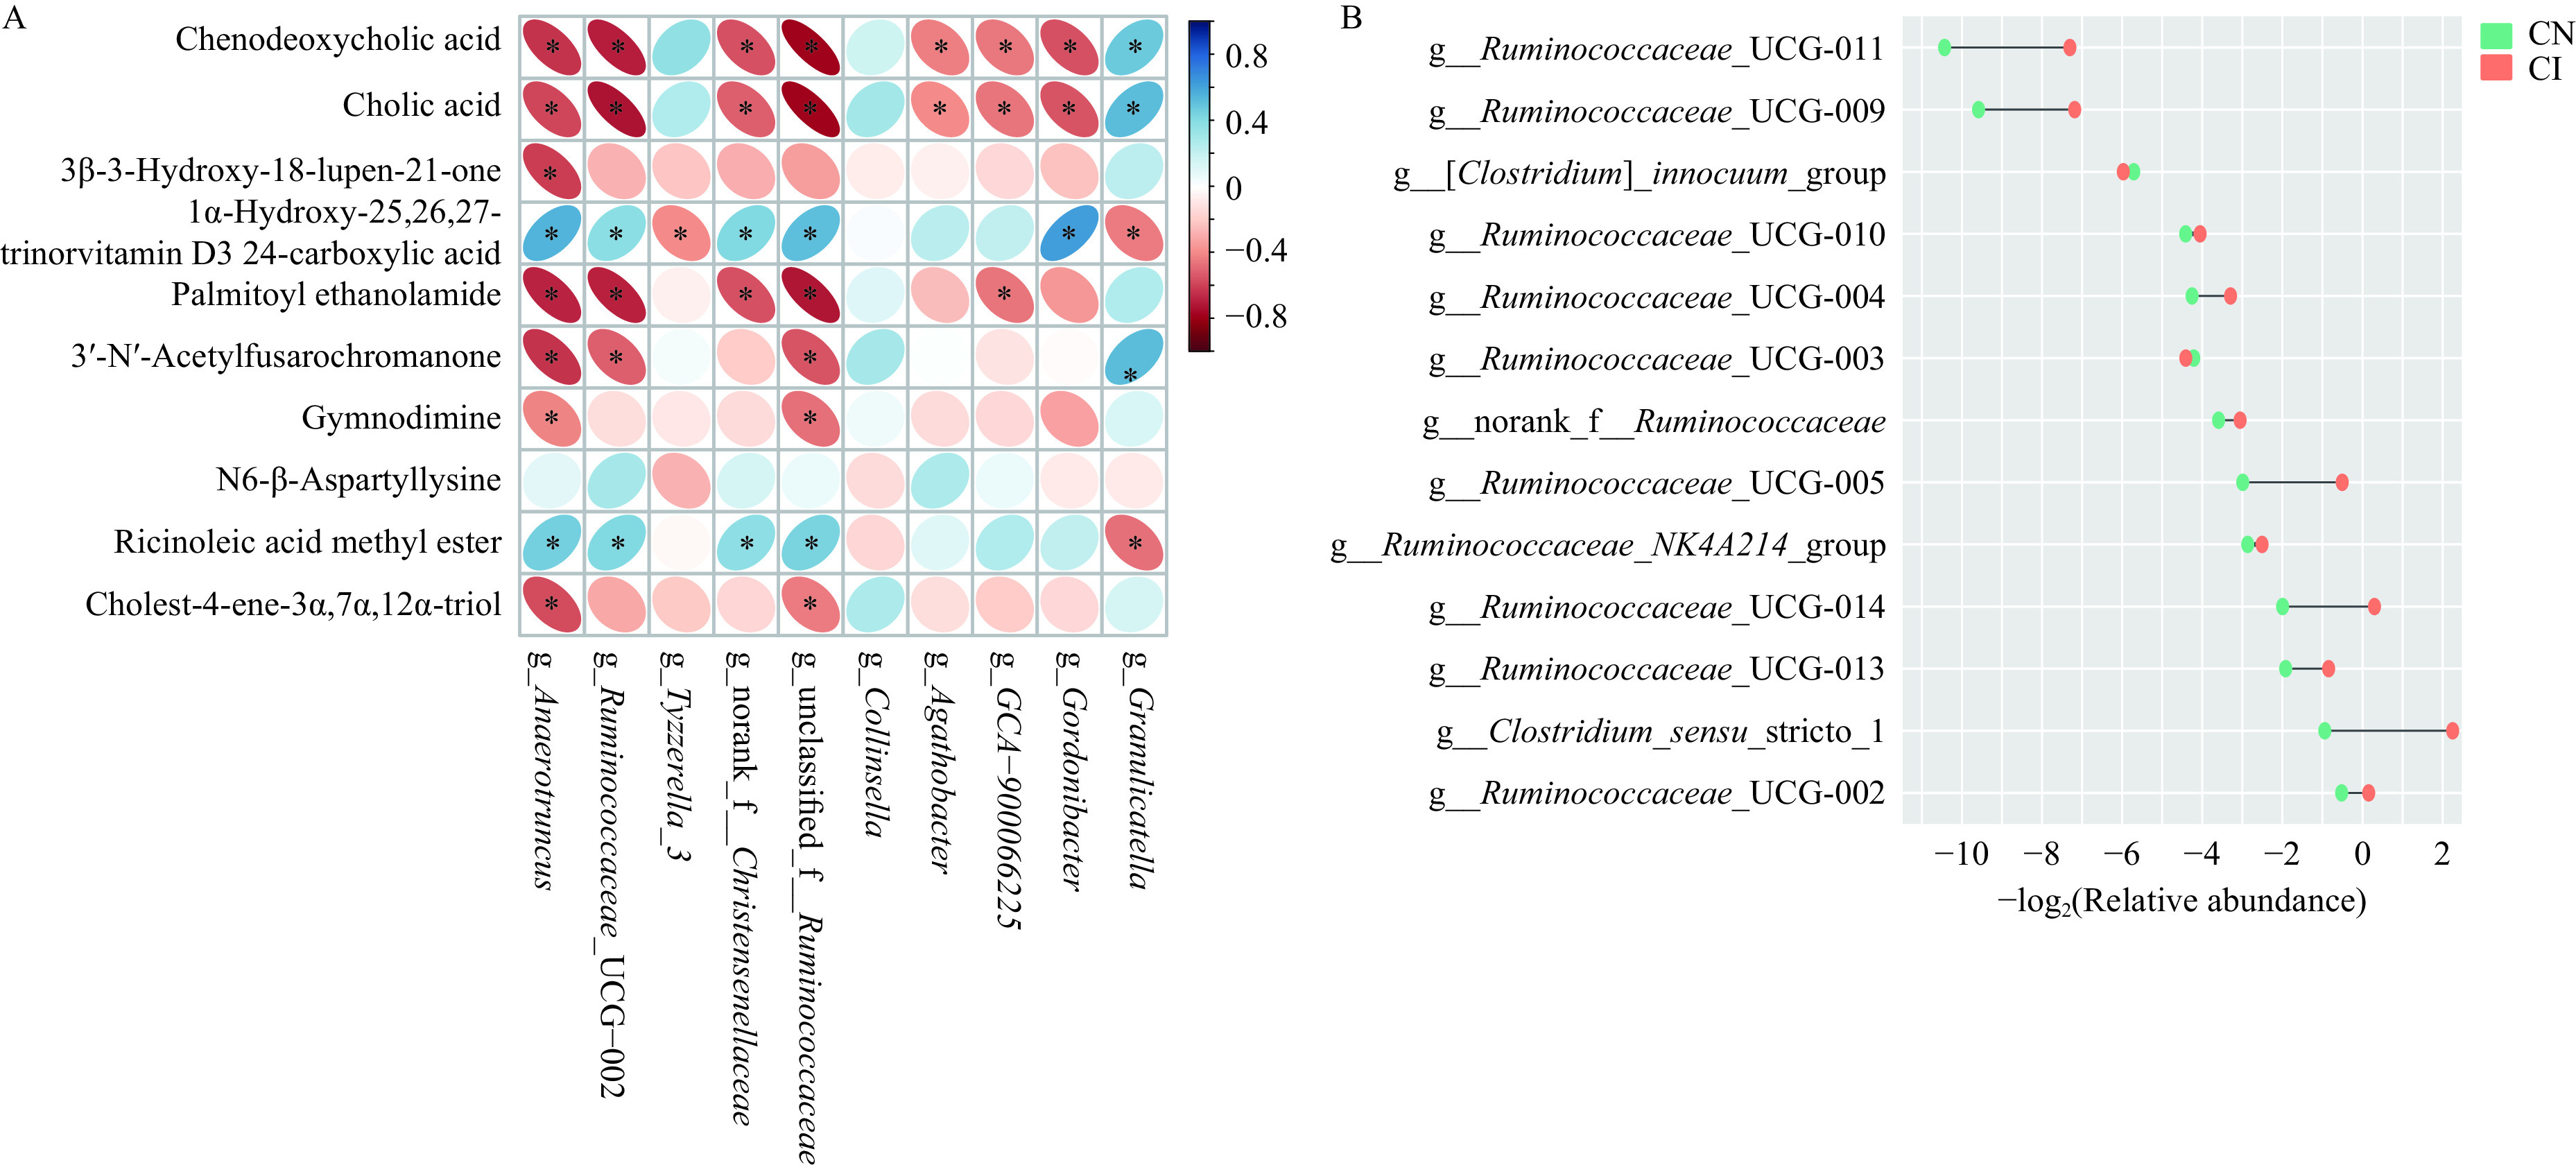
Figure 5. Difference in bacterial species related to bile acids metabolism between patients with CN and CI.

A: The correlation between 10 metabolites with the highest concentrations and 10 bacterial genera with the highest relative abundance (*P<0.05). B: Comparison of genus belonging to family ruminococcaceae between the CN and CI groups. SD: standard deviation; PBA: primary bile acids; SBA: secondary bile acids; CN: normal cognition; CI: cognitive impairments.
