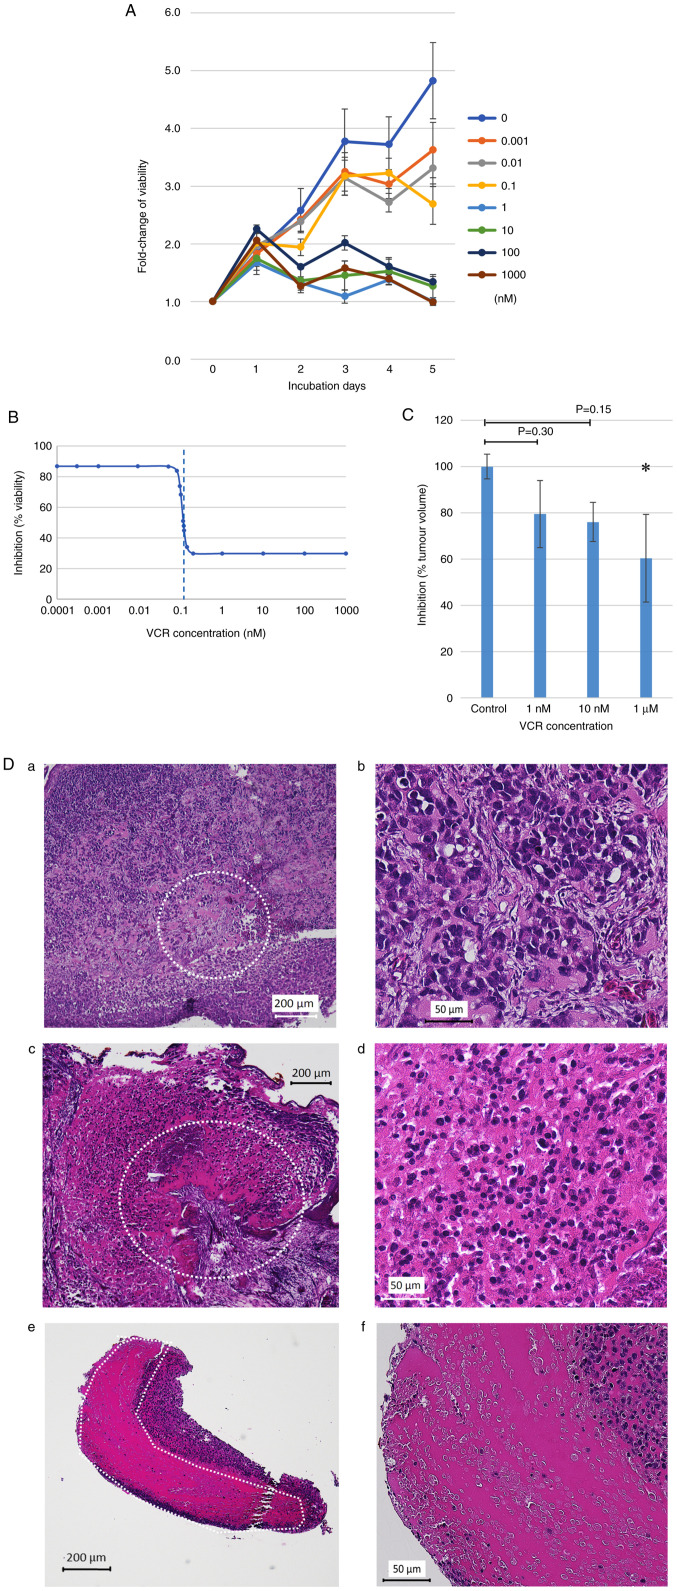
Figure 3.
Administration of VCR resulted in a reduction in tumor volume on the CAM. (A and B) Results of the WST-8 assay. (A) Cell viability curve (VCR concentration, 0 pM-1 µM). (B) Viability inhibition curve on day 3. Half-maximal inhibitory concentration, 0.114 nM (dotted line). (C) Changes in tumor volume due to different concentrations of VCR administration. RD cells were grafted on the CAM on day 9 and 100 µl VCR was administered to each tumor on day 12. On day 16, tumors were resected and volumes were calculated. Data are presented as the mean ± standard error of three independent experiments. Data were analyzed using one-way ANOVA (P=0.0306), followed by Dunnett's post hoc test. *P<0.05 vs. control. (D) Hematoxylin and eosin staining of resected tumors. Necrotic area expansion was VCR concentration-dependent; necrotic areas are outlined with a white dotted line. Xenografts were treated with (a and b) 1 nM, (c and d) 10 nM and (e and f) 1 µM VCR. (a, c and e) ×40 magnification; (b, d and f) ×200 magnification. CAM, chorioallantoic membrane; VCR, vincristine.

