
Fig.1. Characterization of the Somitoid model.
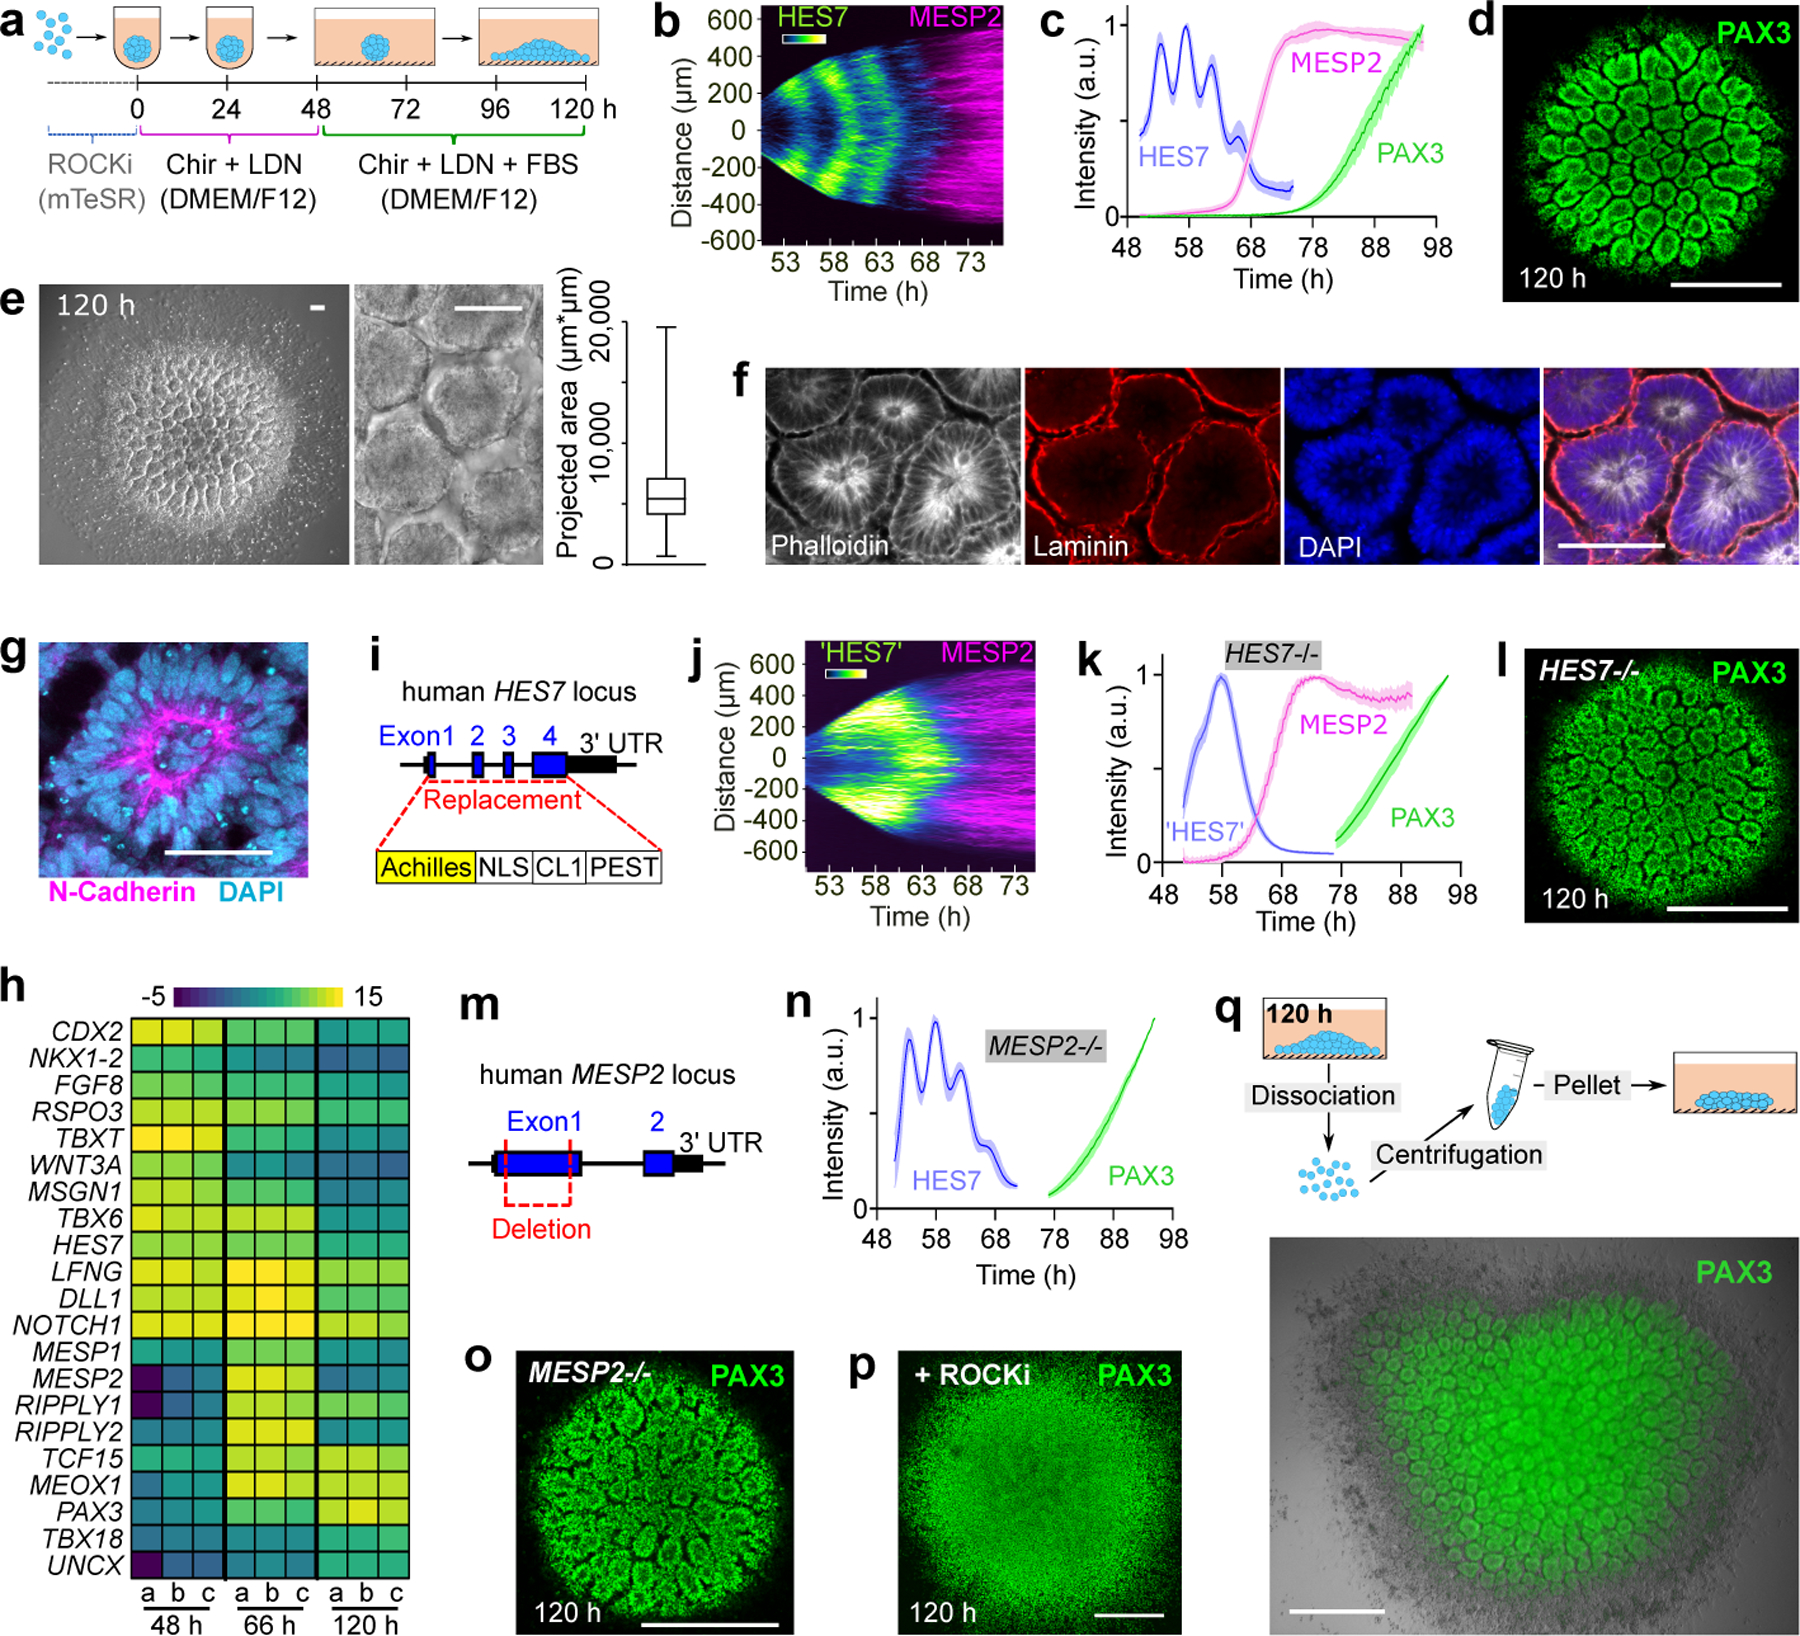
a, Protocol illustration. b, Reporter kymograph from a line scan across the center of Somitoid. c, Temporal profiles (mean±s.d.) of reporters for HES7 (n=5 Somitoids), MESP2 (n=6 Somitoids), and PAX3 (n=6 Somitoids). d, Image of PAX3 reporting Somitoid. e, Bright field images and rosette projected areas (n=1957 rosettes from 20 Somitoids). center line, median; box limits, upper and lower quartiles; whiskers, maximum and minimum. f-g, Immunostaining images of rosettes (n>10 Somitoids). h, Heat map of selected genes in 48 h, 66 h, and 120 h Somitoids (n=3 experiments; 48 Somitoids in each n), as measured by RNA sequencing. Expression levels were calculated by log2 (TPM+0.01). i, HES7 knockout strategy. j, Kymograph of pseudoHES7 and MESP2 reporters in HES7-null Somitoid. k, Temporal profiles (mean±s.d.) of reporters for pseudoHES7 (n=6 Somitoids), MESP2 (n=6 Somitoids), and PAX3 (n=9 Somitoids) in HES7-null Somitoids. l, PAX3 reporter in HES7-null Somitoid. m, MESP2 knockout strategy. n, Temporal profiles (mean±s.d.) of reporters for HES7 (n=6 Somitoids) and PAX3 (n=8 Somitoids) in MESP2-null Somitoids. o, PAX3 reporter in MESP2-null Somitoid. p, Image of PAX3-reporting Somitoid treated with 10 µM ROCKi for 48 h. q, Experiment scheme and image of re-aggregating 120 h Somitoids. PAX3 reporter and bright field images are overlayed. Scale bars 500 µm (d, l, o, p, q); 100 µm (e, f); 50 µm (g).