
Extended Data Fig.10. Embryos stained with Mesp2 HCR probe.
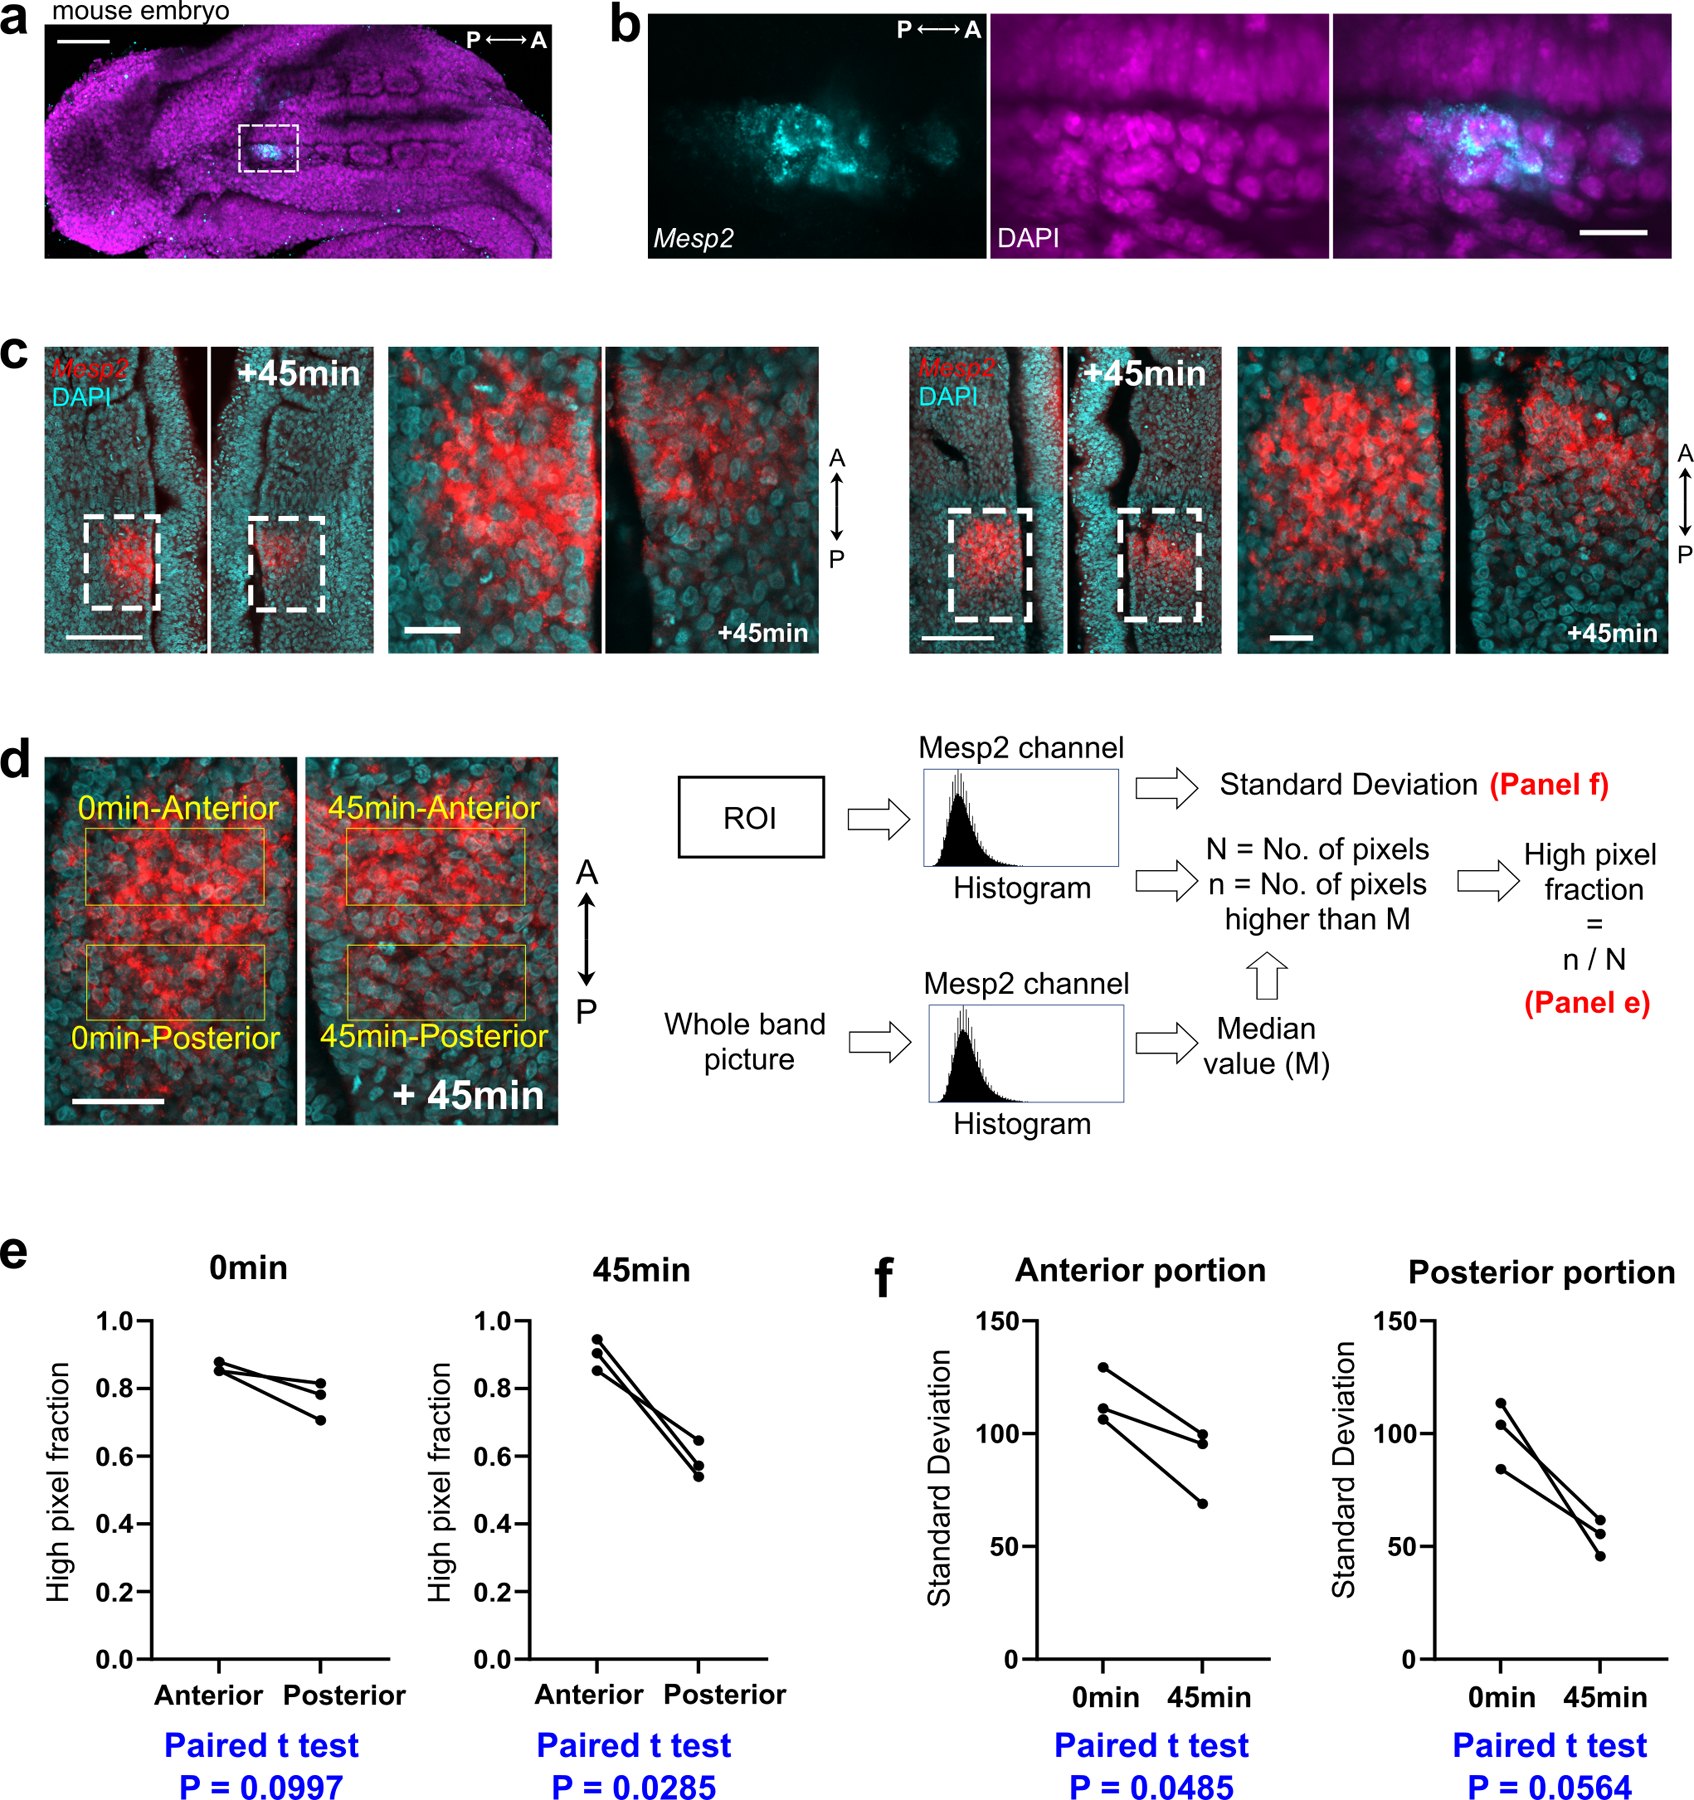
a, Merged maximum-z-projection confocal image of a mouse embryo stained with Mesp2 HCR probe (cyan) and DAPI (magenta). b, Enlarged view of the region indicated by the dotted-line box in a. c, Additional half-embryo pairs stained with MESP2 HCR probe (red) and DAPI (cyan). d, Schemes for quantification. e, High pixel fractions of the anterior and posterior portions of the MESP2 bands at 0 and 45 min. Paired t-test, two-sided. f, Standard Deviations of pixel values in the anterior/posterior portions of the MESP2 bands at 0 and 45 min. Paired t-test, two-sided. Three out of 10 embryos at Time 0 captured the peak of the broad band phase of MESP2 expression, with the criteria that the expression domain roughly occupied the whole segment and MESP2 total intensity was not significantly increased at 45 min. Scale bars represent 100 µm (a, d) and 20 µm (b); 100 µm and 20 µm in corresponding enlarged views (c).