
Fig.3. Characterization of the Segmentoid model.
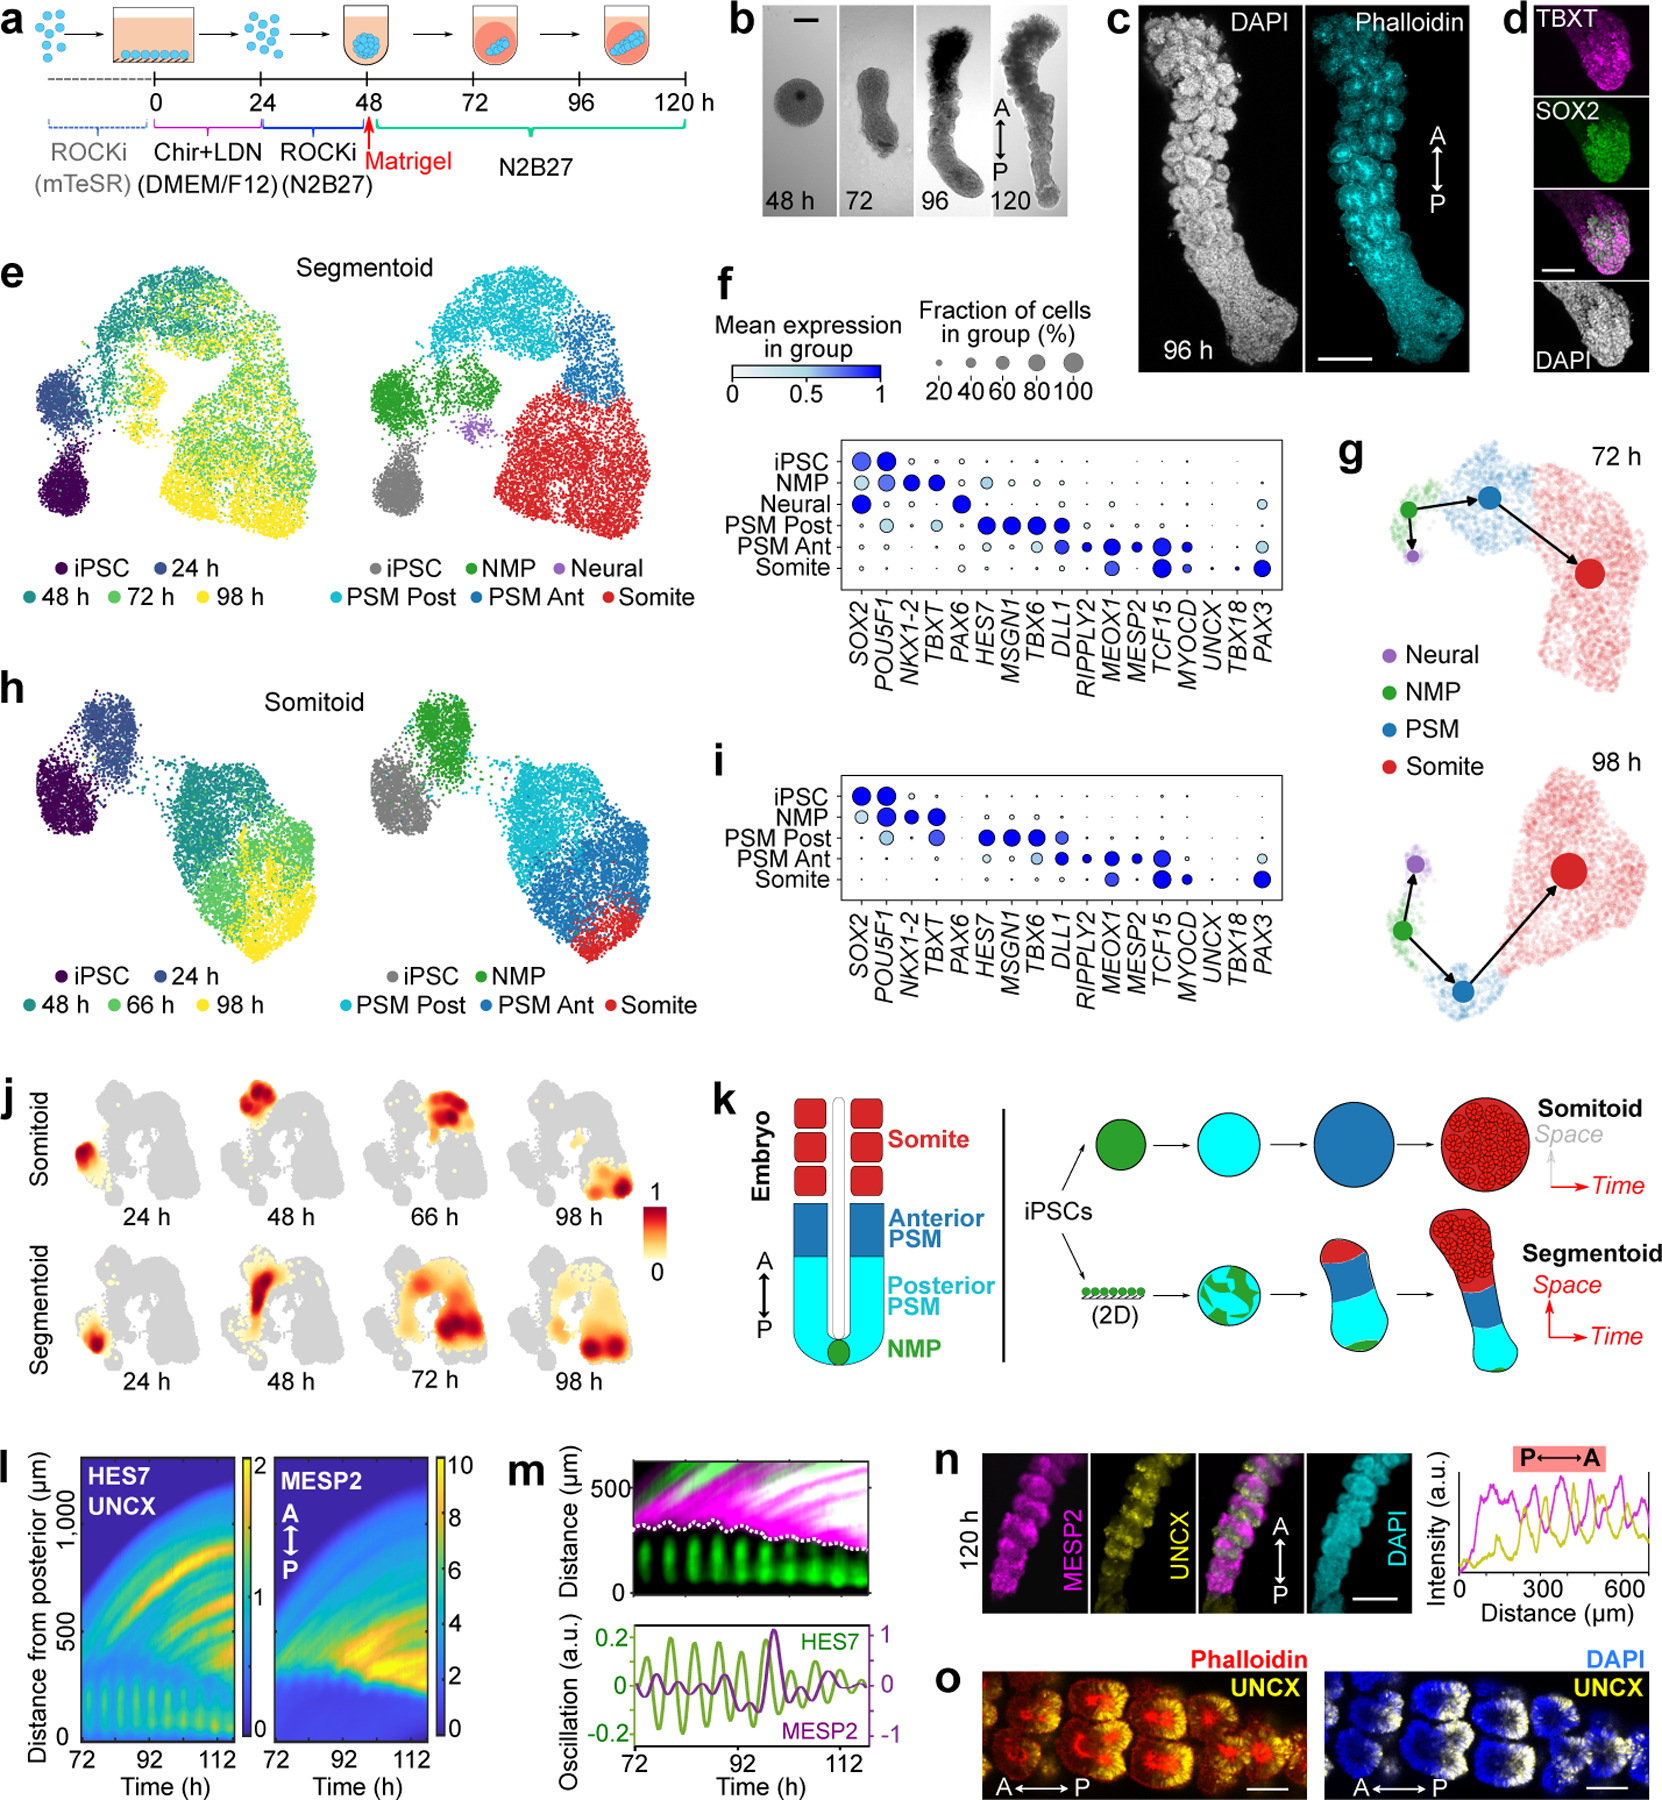
a, Protocol illustration. b, Developmental sequence of a Segmentoid. A, anterior; P, posterior. c, Segmentoid at 96 h (n>10 Segmentoids). d, Posterior tip of 96 h Segmentoid immunostained with TBXT and SOX2 (n>10 Segmentoids). e, UMAP embedding (10,861 cells) colored with timepoints (left) and cell types (right) identified with Leiden clustering. iPSC, 1,491 cells; 24 h, 1,066 cells; 48 h, 1,577 cells from 76 Segmentoids; 72 h, 3,539 cells from 64 Segmentoids; 98 h, 3,188 cells from 32 Segmentoids. f, Dot plot showing expression of selected cell type specific genes in Segmentoids’ clusters. Mean expression of each cluster is scaled per gene. g, PAGA graphs with velocity-directed edges in 72 h (top) and 98 h (bottom) Segmentoids. h, UMAP embedding (8,690 cells) colored with timepoints (left) and cell types (right) following Leiden clustering. iPSC, 1,491 cells; 24 h, 1,265 cells from 96 Somitoids; 48 h, 2,335 cells from 96 Somitoids; 66 h, 2,246 cells from 80 Somitoids; 98 h, 1,353 cells from 48 Somitoids. i, Dot plot showing expression of selected cell type specific genes in Somitoids’ clusters. j, Heatmap of cell density (scaled per timepoint) in UMAP of cells from merged datasets of Somitoids and Segmentoids (19,551 cells). k, Illustration of in vitro models. Each cell type is represented by the same color. l, Kymographs of HES7-Achilles (posterior part in the kymograph), UNCX-YFP, and MESP2-mCherry reporters. Each time point is aligned to the posterior tip. m, Top, kymograph showing expression of the HES7/UNCX (green) and MESP2 (magenta) reporters. Dotted line highlights the start of MESP2 expression. Bottom, HES7 and MESP2 oscillations (Methods). n, Reporter images (left) and intensity profiles (right) along Segmentoid at 120 h (n>10 Segmentoids). o, Images of UNCX-YFP merged with Phalloidin or DAPI (n>10 Segmentoids). Scale bars 200 µm (b, c, n); 100 µm (d, o).