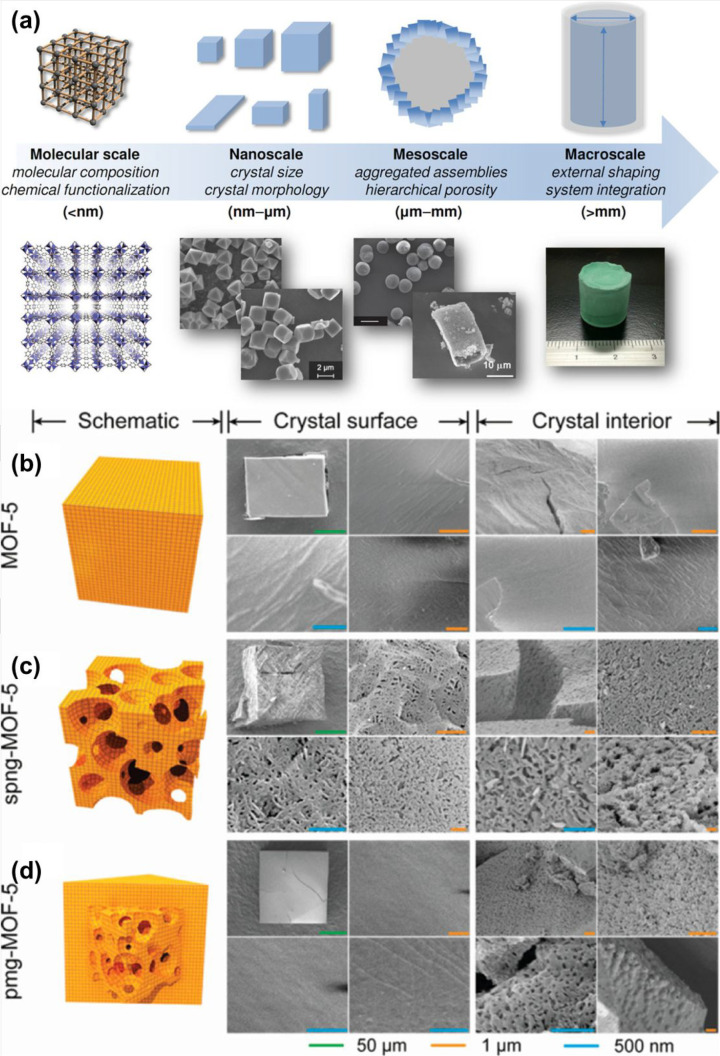
Figure 7.
Measurement ranges applicable to the optimization of MOFs (a). Schematic graphs and scanning electron microscopy (SEM) pictures of the crystal interior as well as the exterior for (b) cubic, (c) spng, and (d) pmg-like crystals of MOF-5. Reprinted with permission from ref (102). Copyright 2018 John Wiley and Sons.

