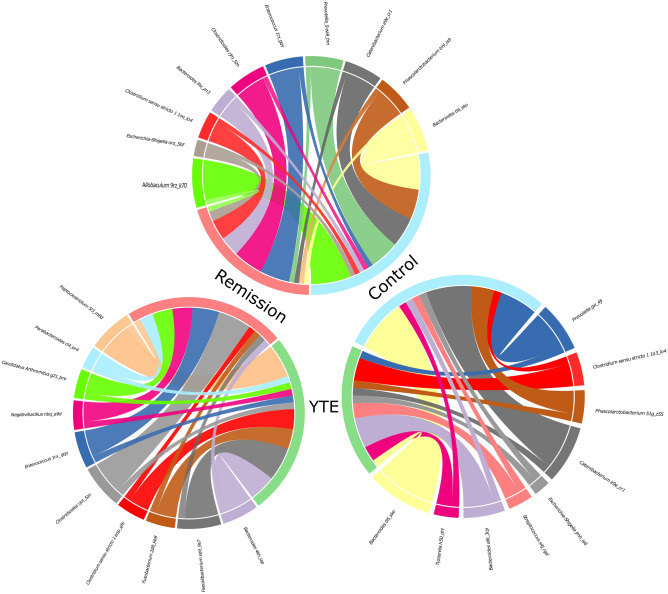
Figure 4.
Chord diagrams showing the associations between differentially abundant taxa of Yorkshire Terrier Enteropathy (YTE), Remission and Control groups. Only the most abundant microbiome ASVs detected are shown. For better comprehension, each circle include two comparisons each time (remission in light red, YTE in green, and control in light blue). The chord diagrams show the key bacterial taxa identified by their comparative abundance. The outer ribbon identifies the respective clinical states (groups) and encompasses the perturbed taxa associated with each state. Chords connect taxa related to more than one state in the inner circle. Only significant hits are represented in these chord charts (at least p < 0.05).

