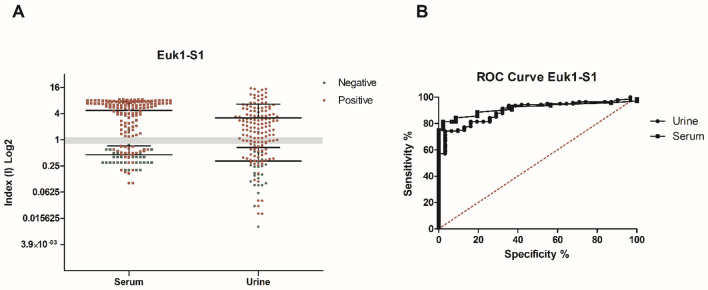
Figure 1.
Comparative diagnostic performance of rSARS-CoV-2 Euk1-S1 protein with patient urine and serum samples. (A) ELISA assays were done using positive samples (n = 140 urine and n = 140 serum) from COVID-19 patients with previously positive qRT-PCR and negative samples (n = 31 urine and n = 46 serum). The mean of each group is shown and the gray band indicates indeterminate values for each sample, while index values below the range (< 0.8) are negative and values above (> 1.1) are considered positive. (B) Receiver Operating Characteristic (ROC) curves were constructed using the individual index (I) value for each sample, to obtain sensitivity, specificity and area under the curve values.

