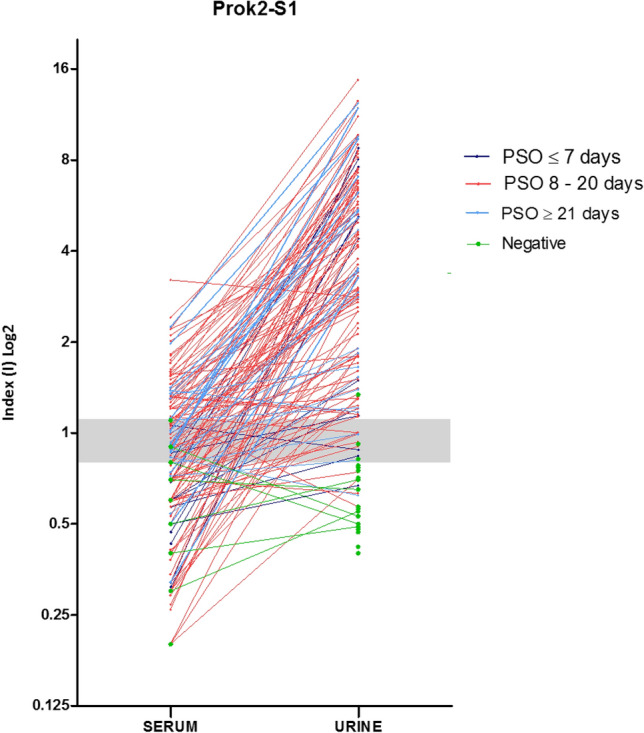
Figure 6.

Evaluation of comparative urine and serum index values (I) of each patient according to the days post-symptoms onset (PSO) by using rSARS-CoV-2 Prok2-S1 protein. The index values obtained from urine and serum samples for each patient are represented by circles and when paired they are interconnected by lines, each color being specific to the collection period after the onset of symptoms Individual data were divided according to the PSO days of the collection date, i.e. at ≤ 7 days, 8 to 20 days and ≥ 21 days.
