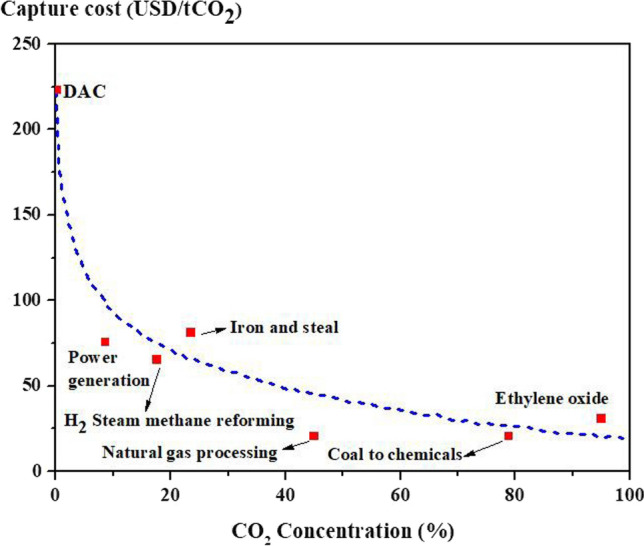
Fig. 15.

Carbon capture cost of different processes as a function of carbon dioxide concentration, data from IEA for 2020 (IEA 2022). tCO2, tons of carbon dioxide; USD, United States Dollar; DAC, direct air capture; H2, hydrogen; CO2, carbon dioxide

Carbon capture cost of different processes as a function of carbon dioxide concentration, data from IEA for 2020 (IEA 2022). tCO2, tons of carbon dioxide; USD, United States Dollar; DAC, direct air capture; H2, hydrogen; CO2, carbon dioxide