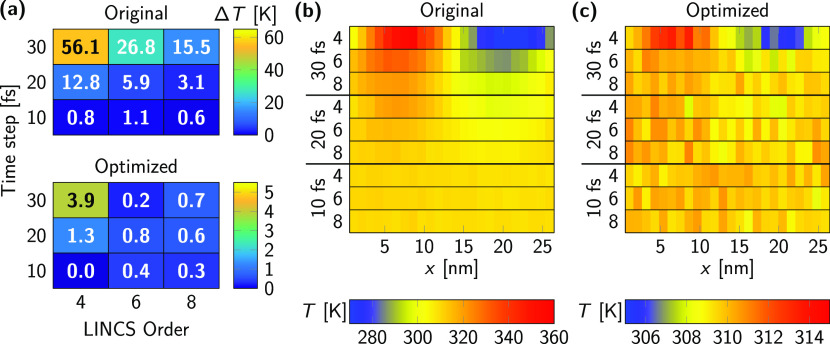
Figure 3.
Temperature difference ΔT between DLiPC and DPPC lipids and between different phases in MD simulations of phase-separated bilayers using the original and optimized Martini 2 cholesterol model. (a) ΔT between DLiPC and DPPC lipids as a function of time step and lincs_order. We consistently set lincs_iter = 1. (b, c) Local temperature T along the x axis of the simulation box using the original (b) and optimized (c) Martini 2 cholesterol models. Note the different temperature scales in b and c.

